
Figure 7
- ID
- ZDB-IMAGE-230228-106
- Publication
- Hu et al., 2023 - Transcriptomic and Metabolomic Studies Reveal That Toll-like Receptor 2 Has a Role in Glucose-Related Metabolism in Unchallenged Zebrafish Larvae (Danio rerio)
- All Figures
- Figures for Hu et al., 2023
|
Figure 7
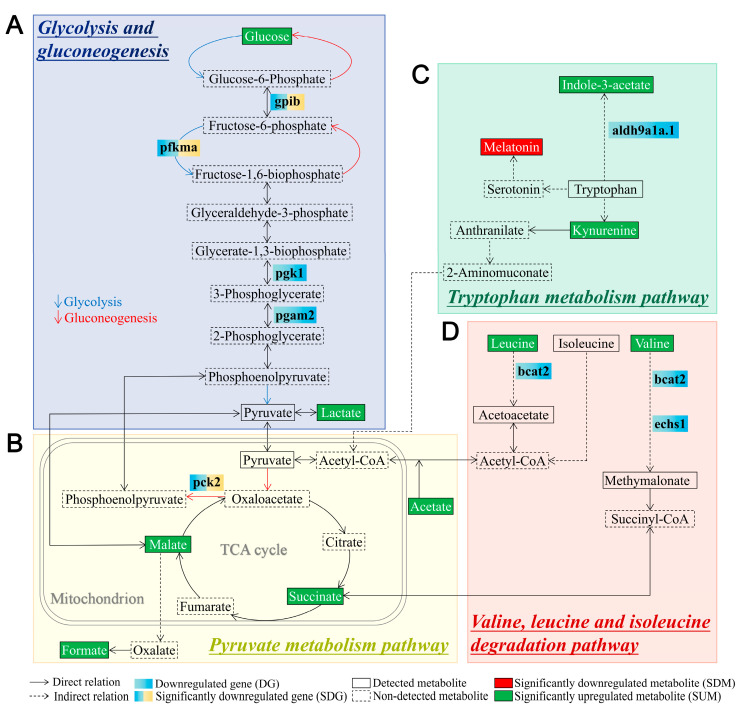
Schematic diagram of differentially expressed metabolites and genes in the significantly enriched signaling pathways associated with metabolism in tlr2 mutant zebrafish larvae compared to wild type control. (A) Glycolysis and gluconeogenesis pathway. (B) Pyruvate metabolism pathway. (C) Tryptophan metabolism pathway. (D) Valine, leucine, and isoleucine degradation pathway. The notes for each icon in the diagram are at the bottom of the diagram. For RNAseq data, setting the S value ≤ 0.005 as the cutoff to find significantly expressed genes. For NMR data, significance was established at p < 0.05. The genes shown in blue boxes are non-significant downregulated genes in tlr2 mutant larvae (log2 fold change level and S value of pgk1 is -0.59 and 0.022, pgam2: −0.50, 0.061, aldh9a1a.1: −0.56, 0.014, bcat2: −0.45, 0.089, echs1: −0.73, 0.024. Table S2).