
|
Fig. 1
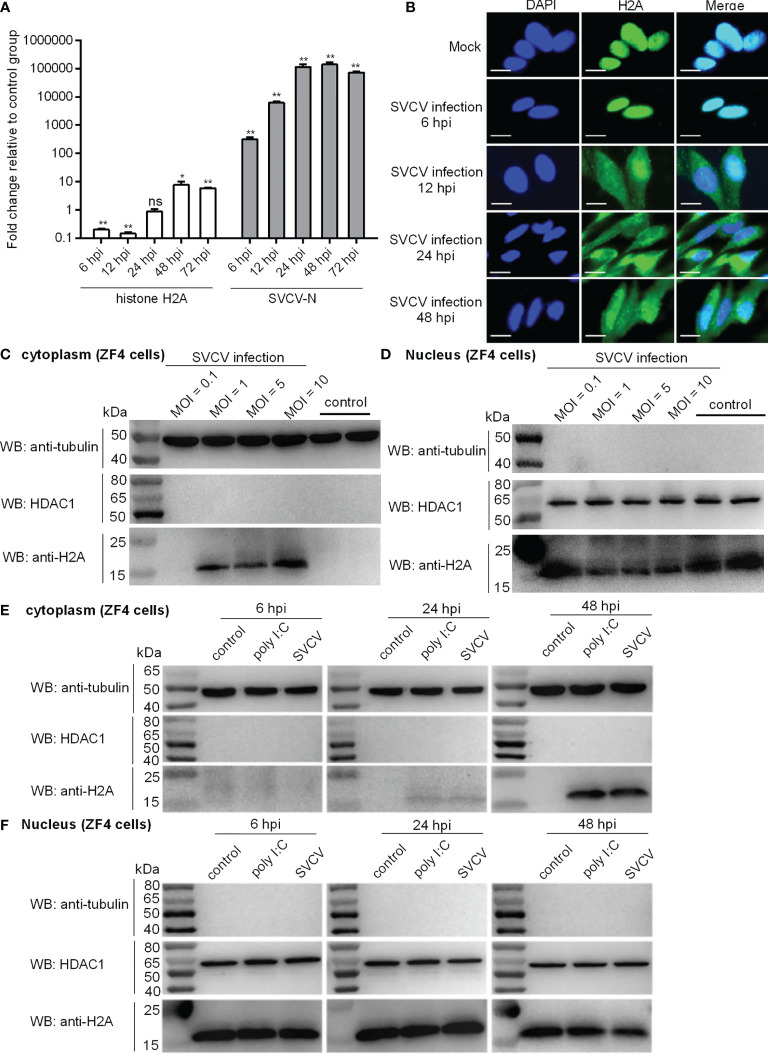
Expression and subcellular localization of zebrafish histone H2A. (A) The expressions of histone H2A and SVCV-N in zebrafish larvae in response to SVCV infection. Total RNA was extracted from zebrafish larvae collected at 6, 12, 24, 48 and 72 hpi. Data represented means ± SEM (n = 3), and were tested for statistical significance. *p < 0.05; **p < 0.01; ns, not significant. (B) Subcellular localization of zebrafish histone H2A by immunofluorescence analysis in the mock-infected and SVCV-infected ZF4 cells. Scale bar: 10 μm. (C) Cytoplasmic fractions from the mock-infected and SVCV-infected ZF4 cells. (D) Nuclear fractions from the mock-infected and SVCV-infected ZF4 cells. For (C, D), ZF4 cells cultured in 6-well plates overnight were infected with SVCV at an MOI of 0.1, 1, 5 and 10. At 24 hpi, the cells were harvested and used for preparation of nuclear and cytoplasmic extracts. (E) Cytoplasmic fractions from SVCV-infected, poly I:C-stimulated and untreated ZF4 cells. (F) Nuclear fractions from SVCV-infected, poly I:C-stimulated and untreated ZF4 cells. For (E, F), ZF4 cells passed in 6-well plates overnight were infected with SVCV at an MOI of 1 or stimulated with poly I:C (10 μg/mL) or left untreated. At 6, 24 and 48 hpi, the cells were harvested and used for preparation of nuclear and cytoplasmic extracts.