
|
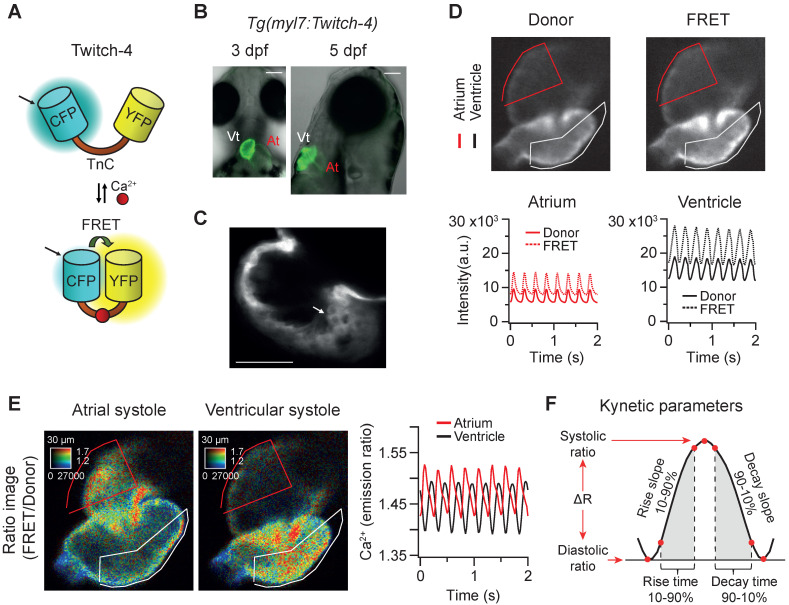
Fig. 1
In vivo recording of Ca2+ dynamics in the beating heart of Tg(myl7:Twitch-4) zebrafish larvae. (A) Schematic structure of the Ca2+ biosensor Twitch-4 and its principle of action (FRET, Förster resonance energy transfer). (B) Overlay of transmitted light and fluorescence images of 3 and 5 dpf larvae showing the ventral and lateral orientation of the heart after mounting (At - atrium, Vt - ventricle). The scale bar represents 100 μm. (C) Confocal image of a 3 dpf larva showing the cytoplasmatic localization of Twitch-4 in the cardiomyocytes. The scale bar represents 50 μm. (D) Fluorescence intensity images of the donor and FRET channels of a 3 dpf larva heart in ventricular systole. Regions-of-interest (ROI) were manually drawn on the atrium and ventricle and their mean pixel value was obtained at each timepoint. The traces show the time course of fluorescence intensity of the donor and FRET channels. (E) Emission ratio images (FRET image/donor image) in pseudo color of atrial and ventricular systoles in a 3 dpf larva. The calibration squares show the distance in µm, whereas the hue codes for the emission ratio and intensity codes for the fluorescence intensity. The traces show the atrial and ventricular Ca2+ levels (emission ratios) over time. (F) Kinetic parameters calculated from the ratio time course data (see Methods for their definition).