
|
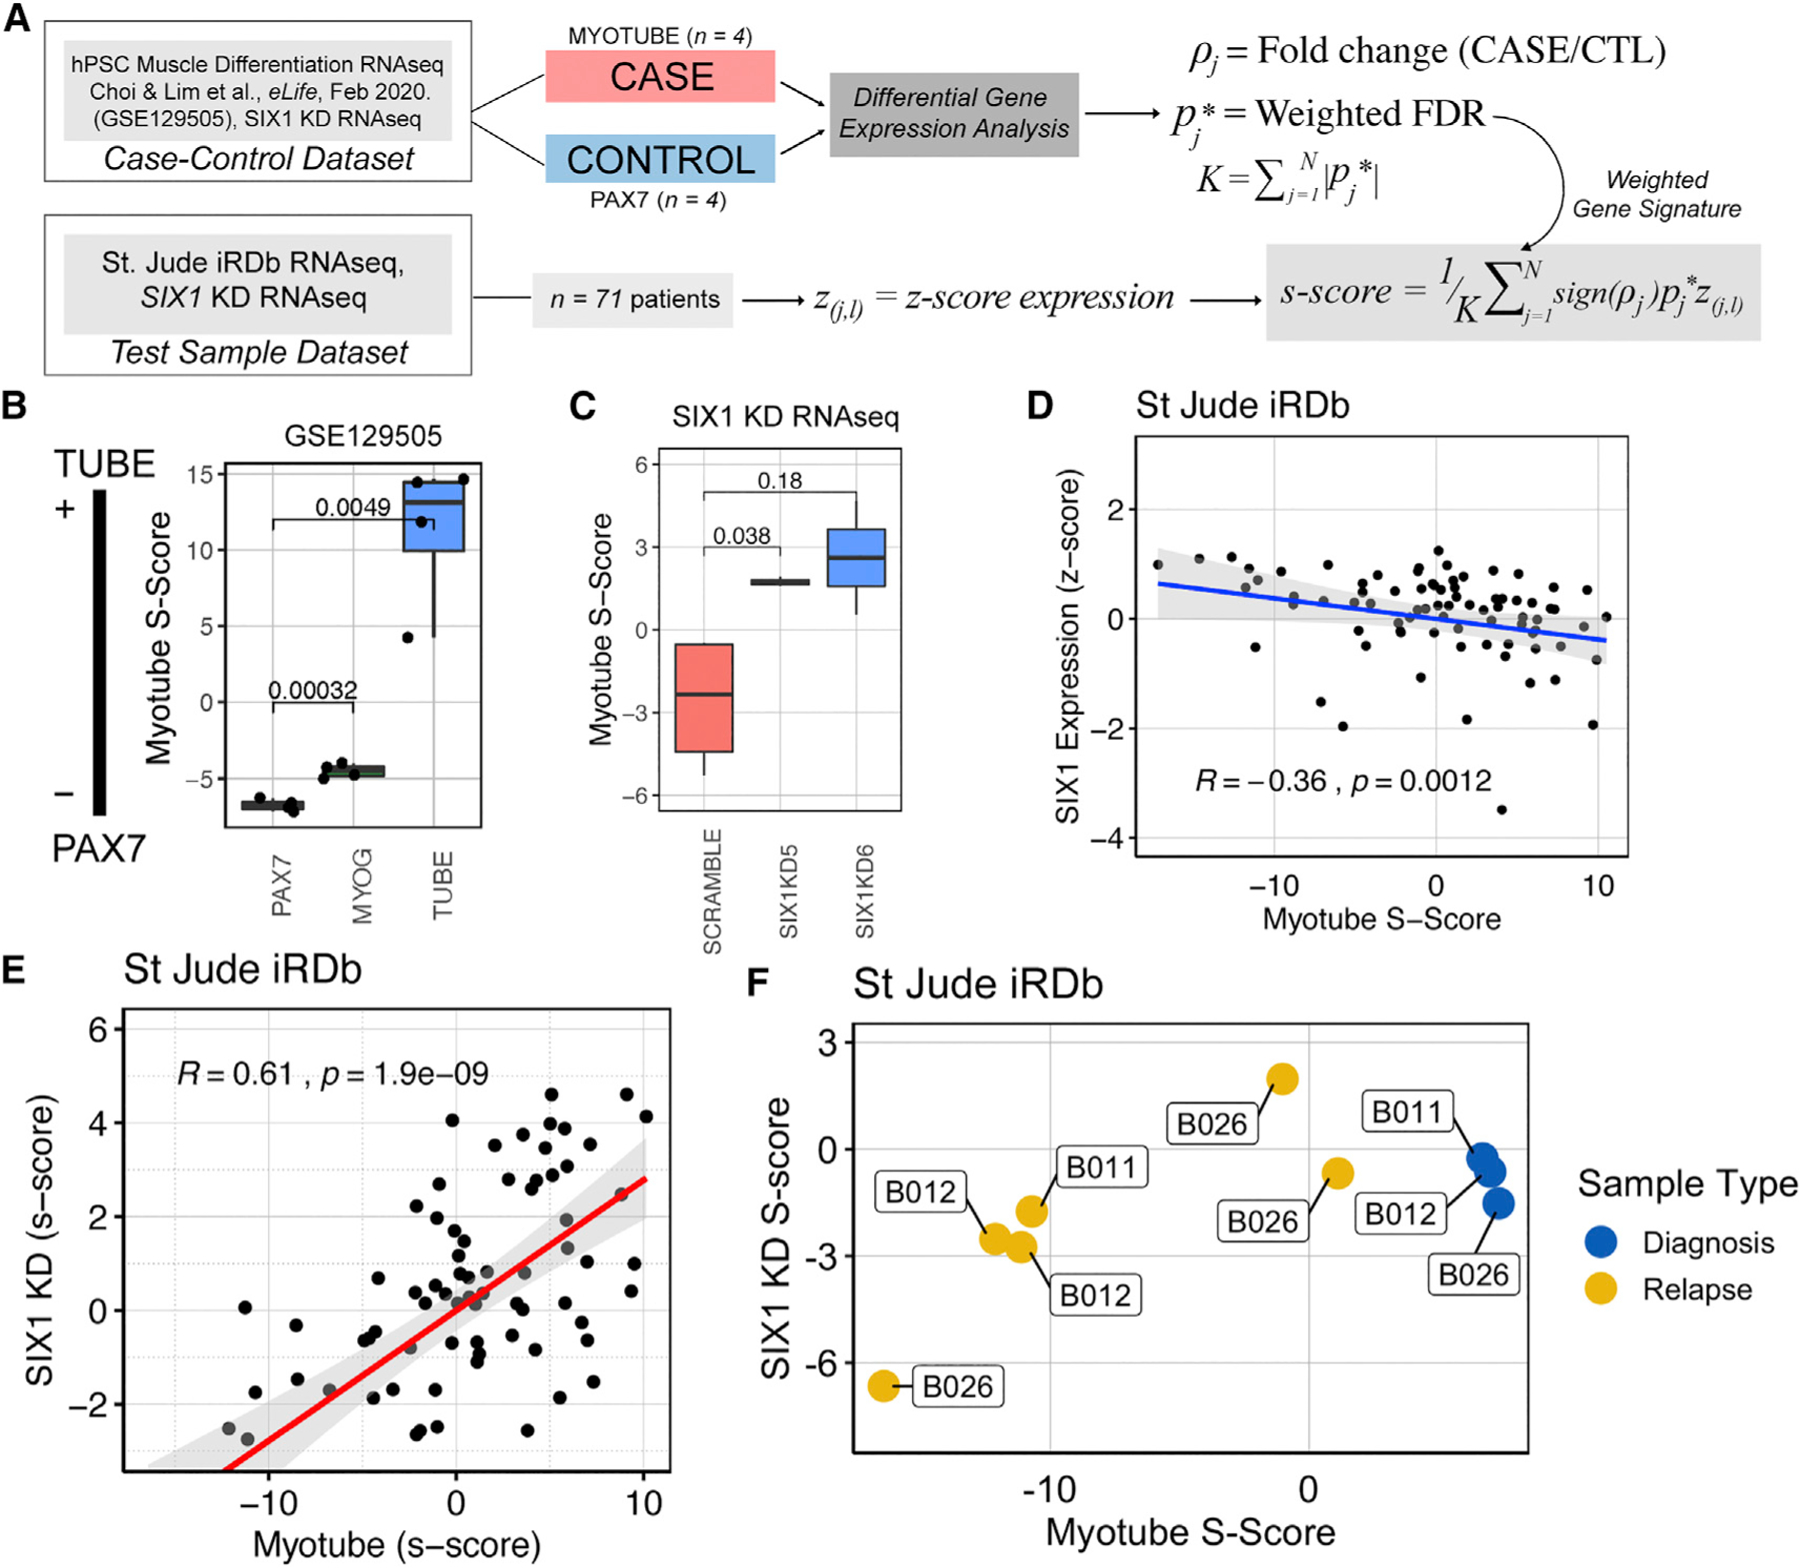
Fig. 7
(A) Overview of the S scoring methodology, where gene expression in the case-control data is used to generate a weighted gene signature to score test sample transcriptomes on a continuous scale.
(B) Myotube S scores for samples used in the training set plotted as proof of concept that the myotube S score can quantify myogenic differentiation status. Statistical differences were measured by Student’s t test.
(C) Myotube S scoring methodology applied to the SIX1 KD RNA-seq dataset, demonstrating that SIX1 KD cells are more advanced in the myogenic lineage than Scramble cells. Statistical differences were measured by Student’s t test.
(D) Scatterplot of myotube S scores plotted against SIX1 Z score-converted expression and Spearman rank correlation coefficient show a moderate inverse correlation between differentiation status and SIX1 expression in St. Jude RMS samples (n = 71).
(E) Scatterplot of SIX1 KD S scores derived from SIX1 KD RNA-seq data against myotube S score shows a strong positive correlation between the SIX1 KD and myotube gene signatures in the St. Jude RMS dataset.
(F) Myotube and SIX1 KD S scores of three individuals, with biopsies collected at multiple stages of disease.