
Figure 2
- ID
- ZDB-IMAGE-230217-73
- Publication
- McGarvey et al., 2022 - Single-cell-resolved dynamics of chromatin architecture delineate cell and regulatory states in zebrafish embryos
- All Figures
- Figures for McGarvey et al., 2022
|
Figure 2
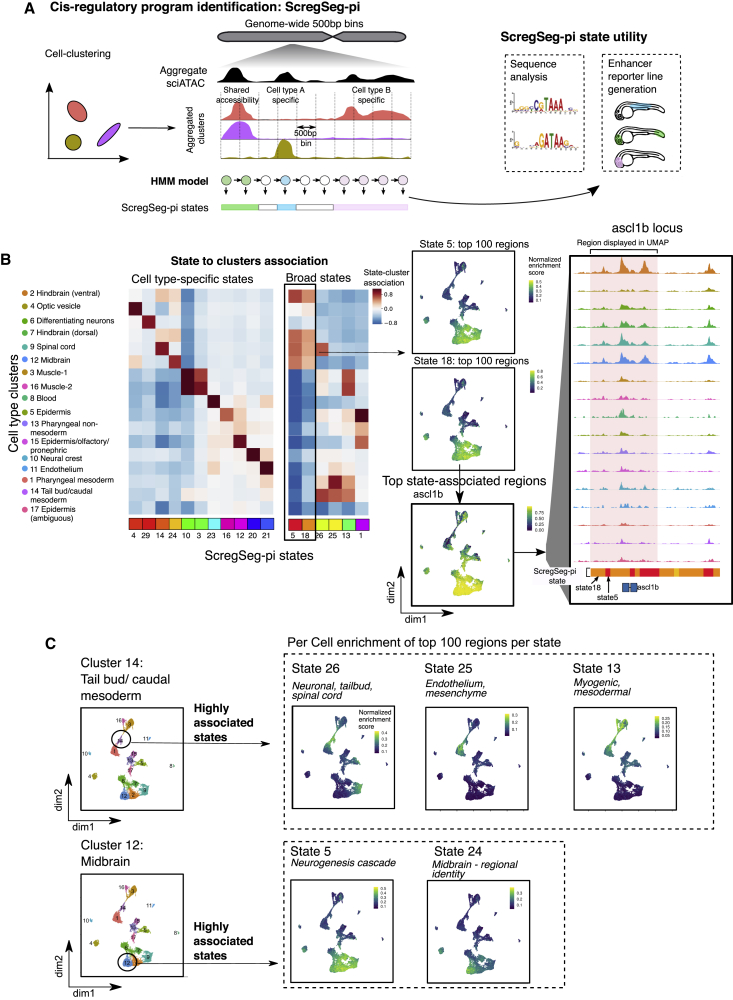
Segmentation of accessibility profiles reveals cell-type-specific and shared regulatory regions
(A) Schematic representation of ScregSeg for identifying regulatory programs (ScregSeg-pi). The genome is divided into 500-bp bins and segmented based on the accessibility distribution over the cluster-collapsed accessibility tracks using a 30-state HMM. The bins are assigned to states that give rise to the classification of the regulatory landscape of the genome.
(B) Heatmap representing the association between states and clusters based on the log-ratio between the states’ emission probabilities and the (normalized) overall read coverage per cluster, which accounts for read depth per cluster (see
(C) Two examples of a cell-type cluster (tail bud and midbrain) that are associated with multiple ScregSeg-pi states (26, 25, and 13 and 5 and 24, respectively). The right-hand panel shows the per-cell distribution of accessibility at the gene body of genes mapping to segments, with the top 100 logFC enrichments for each of these states.