
Image
|
Figure Caption
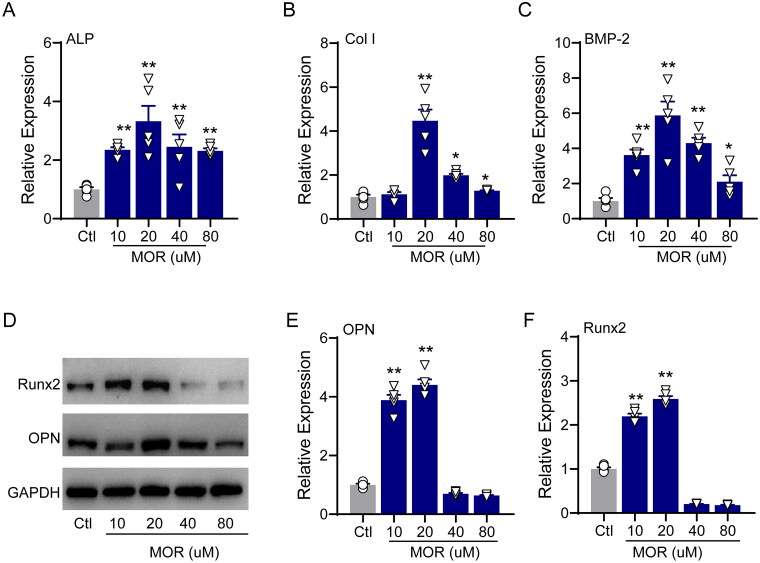
Figure 2.
RT-PCR quantification of the osteogenic differentiation marker genes ALP (A), Col I (B) and BMP2 (C) in the control and MOR treatment groups. (D) Runx2, OPN and GAPDH protein levels were detected by Western blotting in MC3T3-E1 cells. NOR (10 and 20 μM) significantly increased OPN (E) and Runx2 (F) protein levels. *p< 0.05, **p< 0.01 vs. Ctl. n = 6.
Acknowledgments
This image is the copyrighted work of the attributed author or publisher, and
ZFIN has permission only to display this image to its users.
Additional permissions should be obtained from the applicable author or publisher of the image.
Full text @ Pharm Biol