
Image
|
Figure Caption
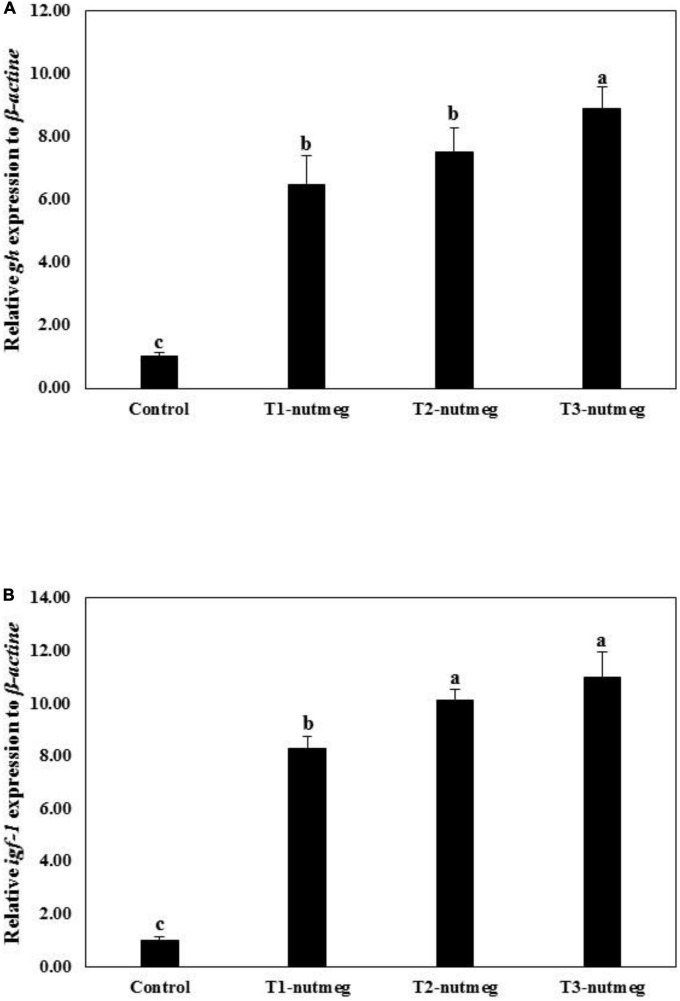
FIGURE 1
Growth hormone (gh) (A) and insulin growth factor-1 (igf-1) (B) gene expression of zebrafish fed the experimental diets (mean ± S.D.). Bars assigned with different small letters denote significant differences among treatments (P < 0.05).
Acknowledgments
This image is the copyrighted work of the attributed author or publisher, and
ZFIN has permission only to display this image to its users.
Additional permissions should be obtained from the applicable author or publisher of the image.
Full text @ Front Nutr