
Image
|
Figure Caption
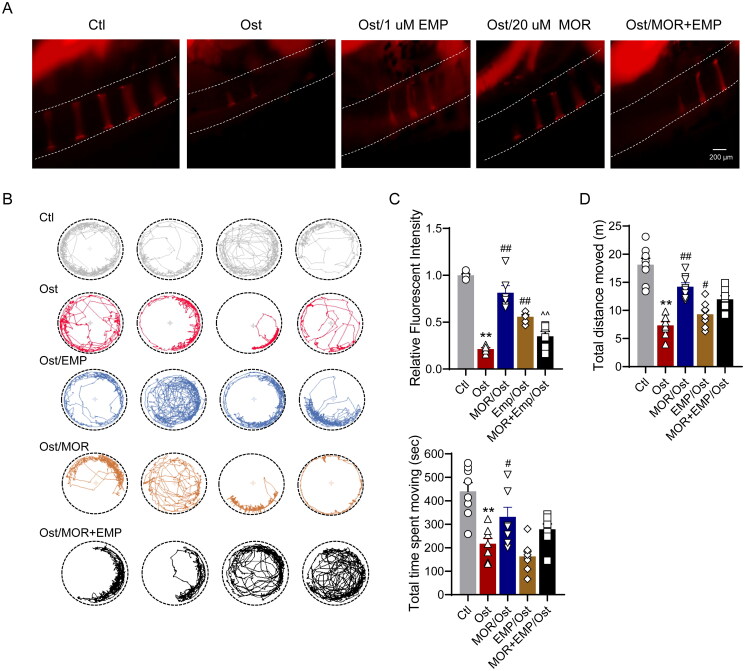
Figure 6.
SLC5A2 inhibitor attenuates the effects of morroniside on OP zebrafish. Representative fluorescence images of normal and MOR-treated zebrafish. (A) Representative fluorescence images of the normal (Nor), OP (Ost), EMP, MOR and MOR + EMP treatment groups. (B) The locomotive trajectory of all groups in 20 min. (C) Quantification of the fluorescence intensity of the spinal cord column. Quantification of the total distance moved (D) and total time spent moving (E) in all groups. **p< 0.01 vs. Ctl; #p< 0.05, ##p< 0.01 vs. Ost; ^^p< 0.01 vs. MOR. n = 6.
Acknowledgments
This image is the copyrighted work of the attributed author or publisher, and
ZFIN has permission only to display this image to its users.
Additional permissions should be obtained from the applicable author or publisher of the image.
Full text @ Pharm Biol