
|
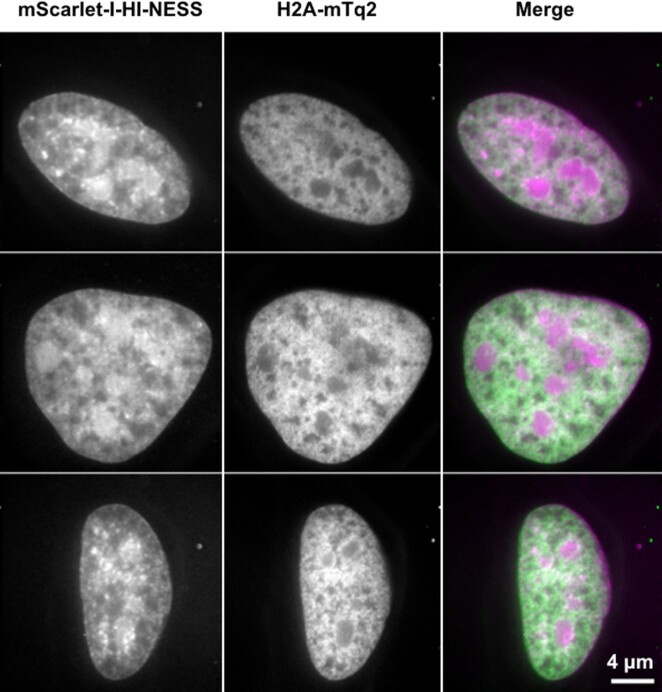
Fig. 5
The distribution of mScarlet-I-HI-NESS (magenta) and H2A-mTq2 (green) in the nuclei of HeLa cells expressing lower levels of the fluorescent proteins (Spinning disk microscopy, single Z-plane). The distribution of the mScarlet-I-HI-NESS signal (left) in the nuclei recapitulates that of earlier experiments (Figures (Figures22 and 4), with the label showing some nucleolar accumulation, and the presence of dense foci. The distribution of H2A-mTq2 (middle), on the other hand, differs (Figures (Figures33 and 4). H2A-mTq2 does not accumulate in the nucleoli of cells expressing lower levels of the protein. H2A-mTq2 also exhibits a visibly different distribution compared to that of mScarlet-I-HI-NESS, with a relatively homogeneous signal over the nucleus and the apparent lack of the dense foci observed with HI-NESS. The discrepancy may arise from the homogeneous binding of H2A-mTq2 along the chromosome, in contrast to the preferential binding of Hoechst and HI-NESS to AT-rich sequences (Supplementary Figure S4; Supplementary Table S1) (4–6).