
|
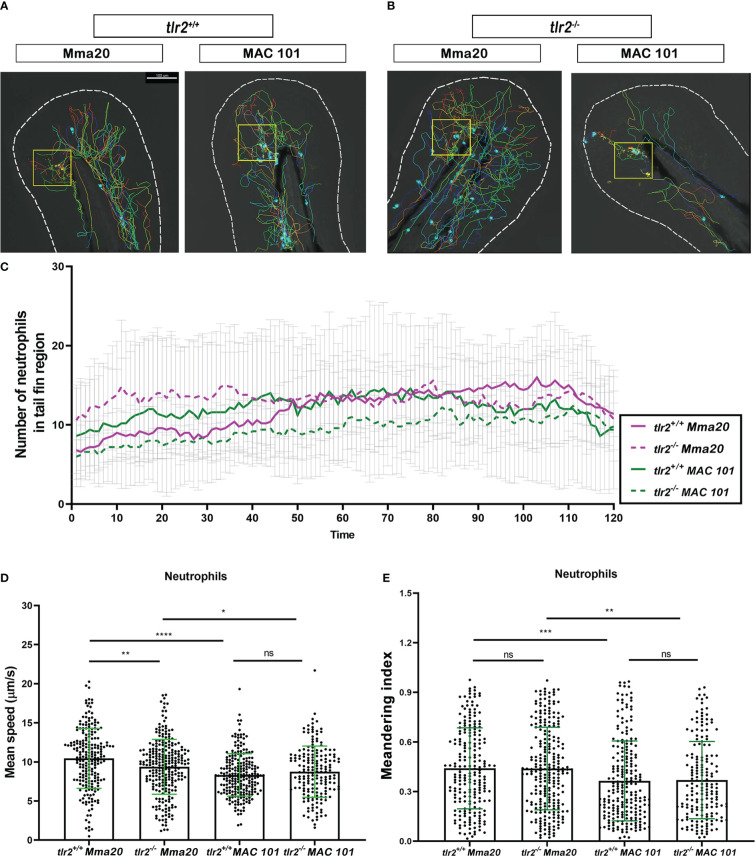
Figure 4
Quantification of neutrophils behavior in tlr2 mutant and wild type control larvae after M. marinum Mma20 or M. avium MAC 101 tail fin infection. (A, B) Representative images of neutrophil tracks in tlr2+/+ or tlr2-/- larvae with Mma20 or MAC 101 tail fin infected. The cyan balls represent the tracked neutrophils, the yellow box indicates the infected area. (C) The number of recruited neutrophils to the tail fin region upon Mma20 or MAC 101 infection. The curves represent the mean value of the recruited neutrophil numbers at different time points. (D) The mean speed of individual tracked neutrophils in the tail fin region. (E) The meandering index of tracked neutrophils in the tail fin region. In (D, E) data (mean ± SD) were combined from three independent experiments with 5 fish in each group. Two-way ANOVA with Tukey’s multiple comparison test as a post-hoc test. ns, non-significant; *P < 0.05, **P < 0.01, ***P < 0.001, ****P < 0.0001. Scale bar: 100 µm; Sample size (n): 217, 254, 228, 179 (D, E).