
Figure 8
- ID
- ZDB-IMAGE-230211-19
- Genes
- Publication
- Brown et al., 2023 - Dermal appendage-dependent patterning of zebrafish atoh1a+ Merkel cells
- All Figures
- Figures for Brown et al., 2023
|
Figure 8
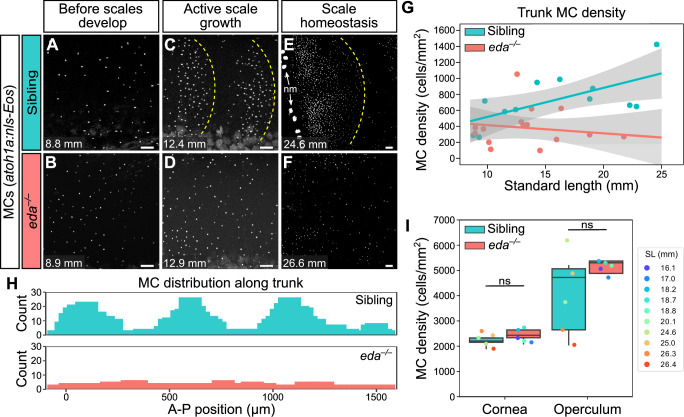
(A–F) Representative confocal images of MCs in the trunk of animals of the indicated genotypes at the indicated stages. Dotted yellow lines indicate posterior scale boundaries. nm, neuromasts of the posterior lateral line. (G) Quantification of MC density in the trunk skin relative to standard length (SL). Gray shading indicates a 95% CI around the linear regression lines. The difference between genotypes was significant above 12.5 mm SL (p<0.05, Johnson-Neyman Technique). Each dot represents an individual fish (N=16–18 fish/genotype). (H) Histograms of the distribution of trunk MCs along a rectangular segment encompassing three scales in a sibling and an identically sized region in an eda mutant (18–19 mm SL). (I) Boxplots of MC densities in the epidermis above the cornea or operculum in animals of the indicated genotypes. ns, not significant (cornea, p=0.21; operculum, p=0.14; Mann-Whitney test). Scale bars: 50 μm (A–F).
Loss of Eda signaling decreases Merkel cell (MC) density in trunk, but not facial skin.