
Figure 6
- ID
- ZDB-IMAGE-230211-16
- Genes
- Publication
- Brown et al., 2023 - Dermal appendage-dependent patterning of zebrafish atoh1a+ Merkel cells
- All Figures
- Figures for Brown et al., 2023
|
Figure 6
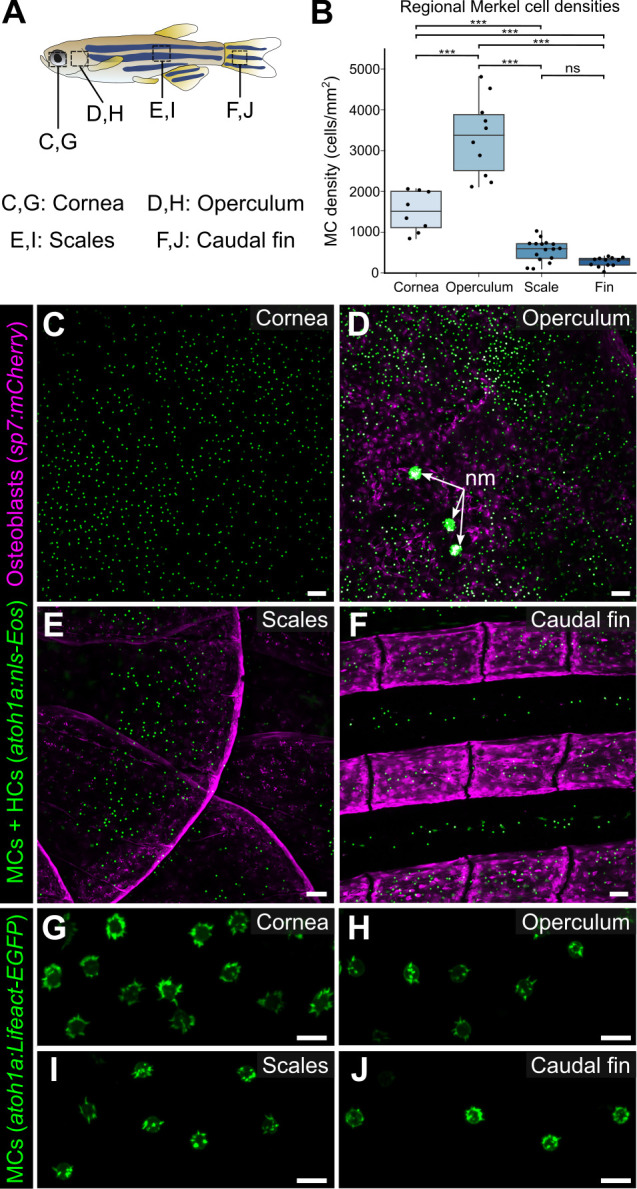
(A) Illustration indicating the epidermal regions imaged in adult zebrafish. (B) Quantification of MC densities in the specified regions. Each dot represents an individual fish (N=8–18, 20–29.5 mm standard length [SL]). *** indicates p<0.001 using a one-way ANOVA (F=83.94; p<0.001) with post-hoc Tukey’s HSD test. (C–J) Lateral confocal micrographs of MCs in the different skin regions from animals expressing the indicated reporters. The regions imaged are indicated in A. Note that MCs expressing Tg(atoh1a:Lifeact-EGFP) have a similar morphology across skin compartments (G–J). nm, neuromasts of the posterior lateral line. Scale bars: 50 μm (C–F) and 10 μm (G–J).
Merkel cells (MCs) are widely distributed across the skin, in compartment-specific patterns.