Figure 3
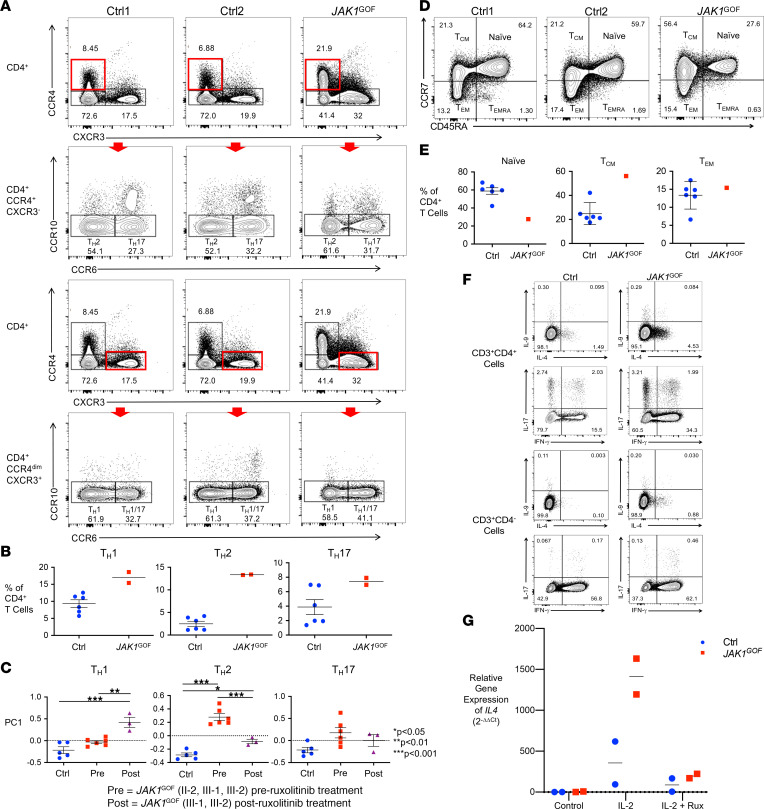
(A) Representative flow cytometry plots of healthy controls (Ctrl) and JAK1GOF patient (II-2) Th2, Th17, Th1, and Th1/17 cell subsets as a proportion of live CD3+CD4+ T cells, identified as CCR4+CXCR3–CCR10–CCR6–, CCR4+CXCR3–CCR10–CCR6+, CCR4–CXCR3+CCR10–CCR6–, and CCR4–CXCR3+CCR10–CCR6+, respectively. The red rectangles highlight the cell population gated on for the subsequent plot identified by the red arrow. This experiment was performed twice with patient samples. (B) Average frequency of Th subsets (data presented as mean ± SEM). Subset frequency calculated by multiplying the proportion of each subset by the sample’s number of CD4+ T cells. (C) PCA of Th subset gene expression from whole blood RNA-Seq data. First principal component (PC) values (data presented as mean ± SEM) were compared between groups using 1-way ANOVA with Bonferri multiple comparisons correction. (D) Decreased proportion of naive CD4+ JAK1GOF T cells. Representative flow cytometry of and (E) proportions of naive, effector memory (TEM), effector memory reexpressing CD45RA (TEMRA), and central memory (TCM) CD4+ T cells. This experiment was performed once with patient cells. (F) Increased frequency of IL-4–, IFN-γ–, and IL-17–secreting JAK1GOF CD4+ T cells and IL-4–, IL-9–, and IL-17–secreting JAK1GOF CD8+ T cells (identified as CD3+CD4– T cells) compared with control. (G) Increased IL4 gene expression in expanded and activated JAK1GOF T cells. Measured using qPCR after 4 hours of stimulation with DMSO control, IL-2, and IL-2 plus ruxolitinib (1 mM). Relative gene expression Ctrl and JAK1GOF were calculated using the Livak method (2–ΔΔCt).

