Figure 2
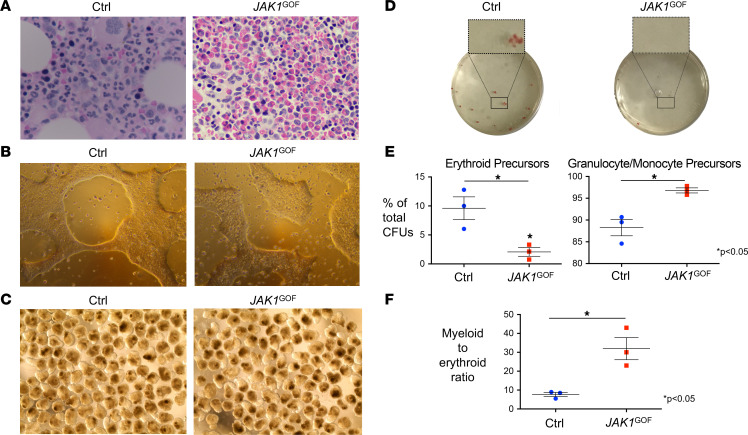
(A) BM biopsy slide obtained from JAK1GOF patient demonstrates an increase in the eosinophil lineage compared with healthy control BM biopsy (Ctrl). Images are at 50× magnification. (B) Representative photographs of JAK1GOF and XY control (Ctrl) iPSCs, demonstrating normal morphology for iPSCs grown in feeder-free culture, including tightly packed iPSCs with well-defined edges. (C) Embryoid body (EB) differentiation of JAK1GOF and Ctrl iPSCs. Images obtained on day 10 of EB differentiation. (D) Representative methylcellulose plates with hematopoietic precursor CFUs, demonstrating increased proportion of hemoglobinized erythroid precursor CFUs in Ctrl compared with JAK1GOF. Experiments represented in B–D were performed 3 times. (E) Decreased proportion of erythroid (CFU-E, BFU-E) CFUs in JAK1GOF compared with Ctrl, with an increased proportion of granulocyte/monocyte precursors (CFU-G, CFU-M, CFU-GM). Average percentage of total CFUs (data presented as mean ± SEM) was compared using a 2-tailed unpaired t test with Welch’s correction. (F) Increased myeloid/erythroid ratio (data presented as mean ± SEM) in JAK1GOF compared with Ctrl using a 2-tailed unpaired t test with Welch’s correction.

