
|
Figure 2
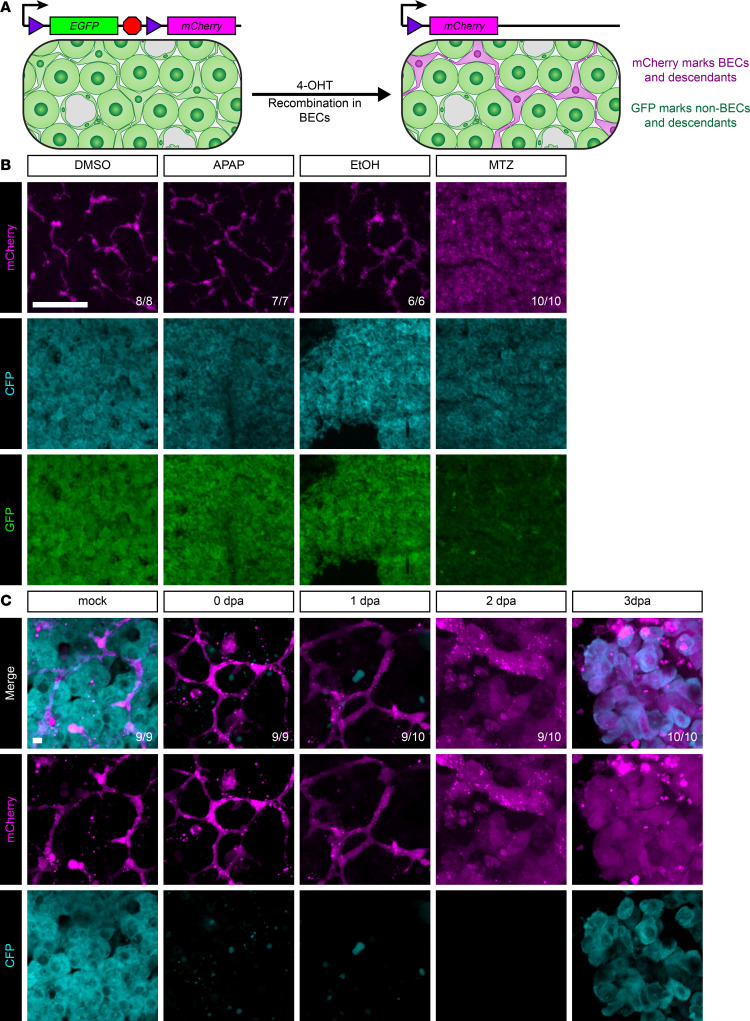
(A) Schematic of recombination in triple-transgenic animals. Prior to 4-OHT administration, all cells in the liver are GFP+. After 4-OHT treatment, biliary epithelial cells are mCherry+. Because these transgenes are integrated into the genome, all descendants of mCherry+ cells will also be mCherry+. (B) Immunofluorescence showing mCherry (magenta, marking biliary and biliary-derived cells), GFP (green, marking hepatocyte-derived cells), and CFP (cyan, hepatocyte identity) signal in the adult liver for animals regenerating from various insults. DMSO, vehicle control (n = 8); APAP, acetaminophen (n = 7); EtOH, ethanol (n = 6); and MTZ, metronidazole (n = 10). Only after MTZ massive hepatocyte ablation do hepatocytes appear mCherry+, indicating biliary origin. Number of animals resembling the representative image are in white in the lower right corner of each image. Scale bars: 50 μm. (C) Live imaging time course of vibratome sections showing mCherry (magenta) and CFP (cyan) signal for adult livers regenerating after MTZ-induced hepatocyte ablation. Time points include mock (n = 9), 0 dpa (n = 9), 1 dpa (n = 10), 2 dpa (n = 10), and 3 dpa (n = 10). This demonstrates clear morphological changes in cells of biliary origin starting at 1 dpa and demonstrates that hepatocytes emerge within the mCherry+ lineage at 3 dpa. Number of animals resembling the representative image are in white in the lower right corner of each image. Scale bars: 5 μm.