
|
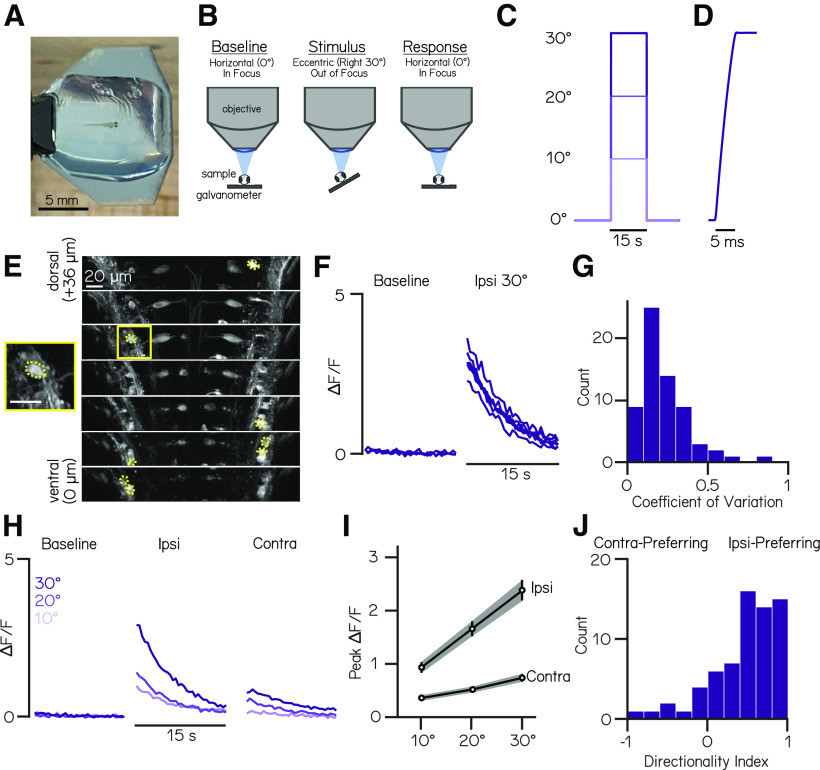
Figure 1.
TIPM produces reliable, directional, and magnitude-dependent responses following roll tilts. A, A 4 dpf larval zebrafish mounted in agarose for roll stimuli on a mirror galvanometer. B, Schematic of our experimental paradigm. Baseline fluorescence (used for normalization) is measured when the platform is horizontal. The galvanometer is then stepped and held at an eccentric angle (Stimulus) where fluorescence is not recorded, then quickly returned to horizontal, whereupon fluorescent recording begins (Response). C, Voltage trace from galvanometer during a 10, 20, and 30° step to the left. D, Feedback voltage from the galvanometer during a step to 30°. E, Slices from a two-photon volume of Tg(nefma:GAL4);Tg(UAS:GCaMP6s) fish. Dashed yellow overlays indicate pixels that correspond to analyzed vestibulospinal neurons. Yellow square shows close-up of a single analyzed cell. Scale bar, 20 µm. F, Normalized fluorescence traces for all trials of one neuron during baseline and response to an ipsilateral 30° roll. G, Distribution of coefficients of variation of peak ΔF/F values across 30° step trials for responsive neurons (n = 69 neurons). H, Mean normalized fluorescence traces for one neuron during baseline and response to ipsilateral and contralateral roll steps of varying magnitudes (10, 20, 30°). I, Mean peak ΔF/F responses across all responsive neurons for ipsilateral and contralateral rolls of 10, 20, and 30° magnitudes. Error bars indicate ± SEM. J, Distribution of directionality indices (see above, Materials and Methods) across all responsive neurons.