
|
Fig. 5
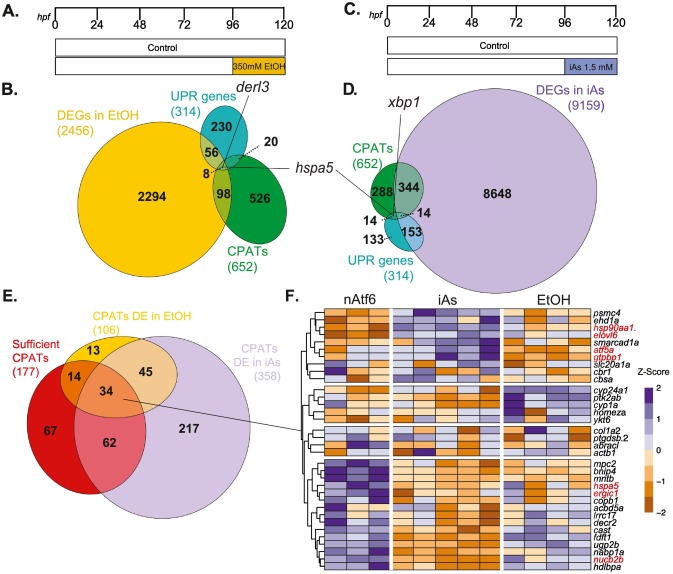
Fig. 5. Stress-free nAtf6 expression and toxicant-induced stress regulate distinct transcriptional signatures in the liver
(A) EtOH exposure scheme showing zebrafish larvae exposed from 96 to 120 hpf with 350 mM EtOH and the livers were dissected and processed for RNAseq at 120 hpf (B) Venn diagram depicting the overlap between significantly DEGs in EtOH conditions (yellow), CPATs (green) and UPR genes (turquoise). (C) Protocol for zebrafish larvae exposed to 1 mM iAs from 96 to 120 hpf. (D) Venn diagram depicting the overlap between significantly DEGs in iAs conditions (violet), Atf6 targets (green) and UPR genes (turquoise). (E) Venn diagram depicting the overlap of CPATs differentially expressed in EtOH (yellow), iAs (violet) and sufficient CPATs defined in Fig. 3 (red). (F) Heatmap showing unsupervised clustering of the 34 common CPATs. (For interpretation of the references to colour in this figure legend, the reader is referred to the web version of this article.)