
Fig. 3
- ID
- ZDB-IMAGE-230207-3
- Publication
- Endo et al., 2022 - Variants in ASPH cause exertional heat illness and are associated with malignant hyperthermia susceptibility
- All Figures
- Figures for Endo et al., 2022
|
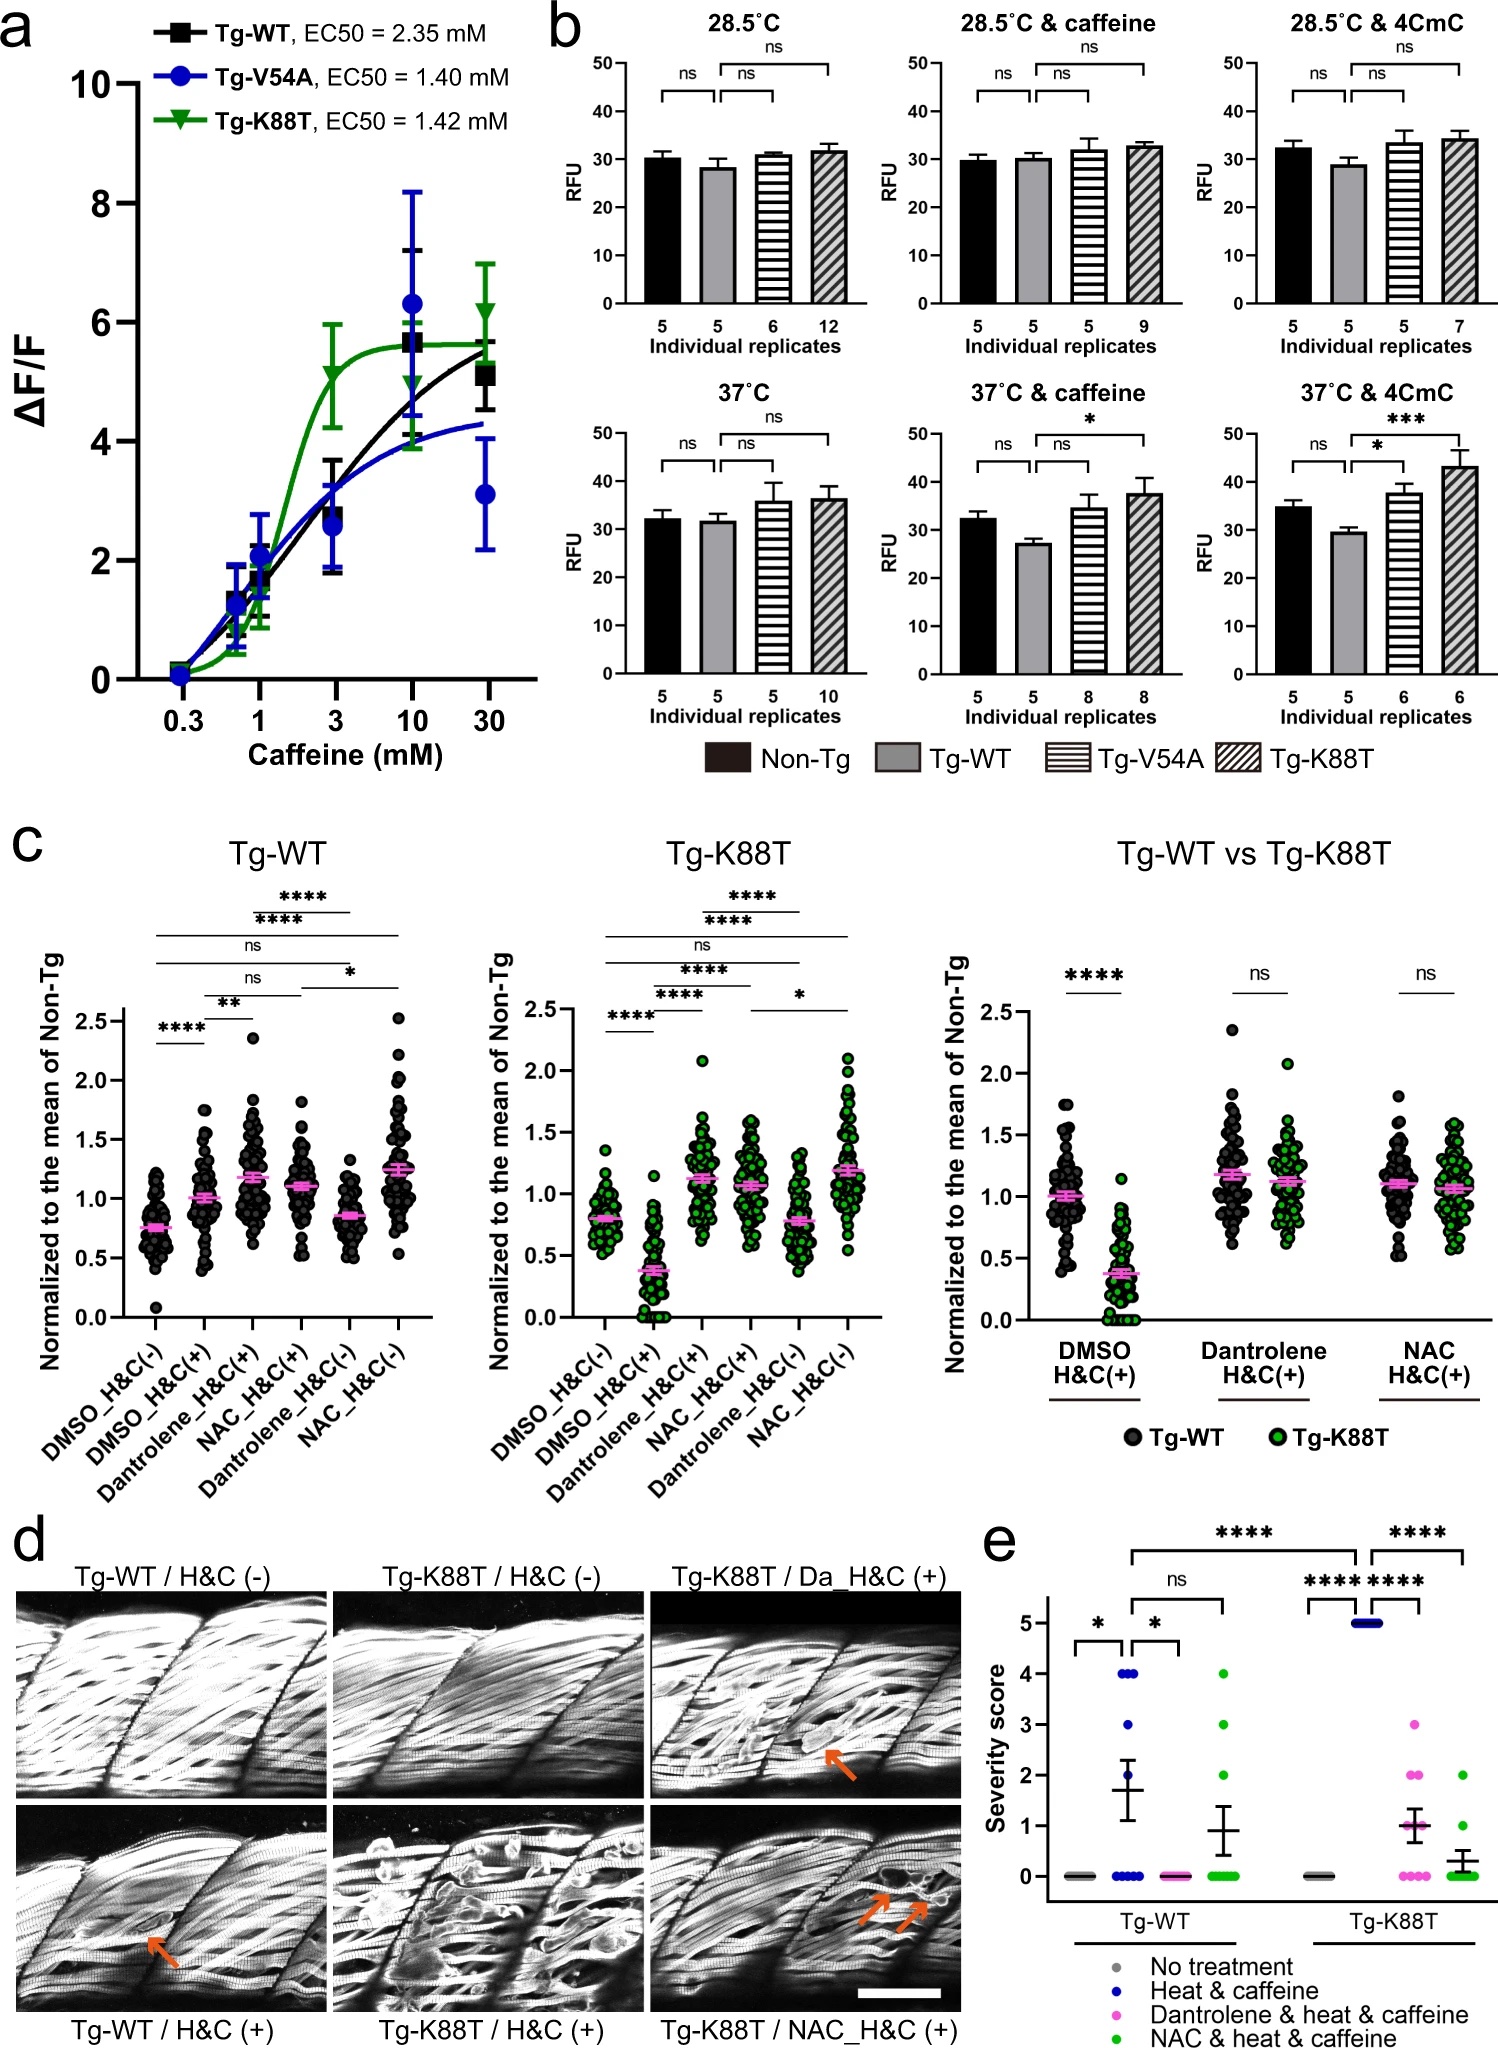
Fig. 3 Junctin mutant zebrafish exhibit heat plus caffeine provoked cellular pathology that is rescued with dantrolene or N-acetylcysteine.
a Concentration dependence of caffeine-induced calcium release in Tg-fish myofibers at room temperature. A leftward shift is seen with K88T (see also Supplementary Table 4 for the numbers of myotubes analyzed). b 2′,7′-dichlorofluorescin diacetate (DCFDA) assay of reactive oxidative species (ROS) reveals increased ROS production with heat plus caffeine or 4-CmC in V54A and K88T transgenic fish. ROS production in 6-dpf fish was measured under the following conditions; (1) no treatment at 28.5 °C, (2) with 1 mM caffeine at 28.5 °C, (3) with 10 μM 4CmC at 28.5 °C, (4) no drug at 37 °C, (5) with 1 mM caffeine at 37 °C, and (6) with 10 μM 4CmC at 37 °C. A replicate consists of 20 fish. Numbers of independent replicates are shown below each bar. Statistical analysis was one-way ANOVA followed by Dunnett’s multiple comparisons test. c–e Dantrolene (Da) and N-acetylcysteine (NAC) protect against heat + caffeine (H&C) induced injury in Tg-WT and Tg-K88T fish. c Swim assay using methodology from Fig. 2c, with 72 fish in each group (three independent experiments with n = 24 fish). Swimming distance of each fish was normalized to the mean of non-Tg with the same condition from the same day. Statistical analysis by one-way ANOVA followed by Tukey’s multiple comparisons test. d Whole-mount immunostaining of transgenic fish after heat + caffeine challenge. Anti-myosin antibody staining was used to illuminate myofibers. High incidence of severe myofiber detachment (arrows) was observed in Tg-K88T exposed to H & C, which was reduced with dantrolene or NAC treatment. Scale bar: 50 μm. e Quantification of muscle damage after a heat and caffeine challenge. The severity of the damage was scored as described in Methods and presented as scattered plots. Ten fish per group were assessed, and the difference between group means was analyzed by Mann–Whitney U test. All data are represented as mean ± SEM. Differences were considered to be statistically significant at P < 0.05 (*), P < 0.01 (**), P < 0.001 (***) or P < 0.0001(****). Source data are provided as a Source data file.