
|
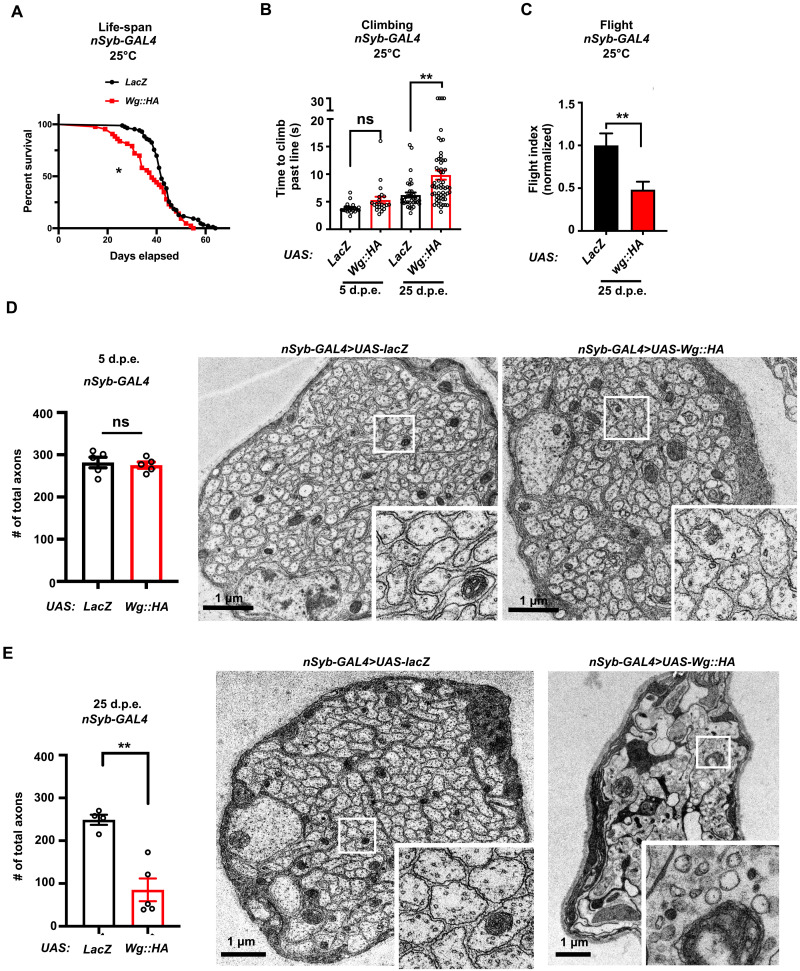
Fig. 4
(A) Survival curves for neuronal expression of UAS-LacZ or UAS-Wg::HA using nSyb-GAL4 at 25°C. A minimum of 43 flies per genotype (*P < 0.05). Statistical analyses were determined by the log-rank test. (B) nSyb-GAL4, UAS-Wg::HA flies exhibit progressive climbing defects. Time (seconds) required for flies of the indicated genotypes to climb past 7 cm (n > 20 per genotype). Statistical analyses are one-way ANOVA followed by a Tukey post hoc test. Results are means ± SEM (**P < 0.01). (C) nSyb-GAL4, UAS-Wg::HA flies exhibit flight defects at 25 d.p.e. compared to nSyb-GAL4, UAS-LacZ controls when dropped into the center of a 2-liter graduated cylinder (n > 32 per genotype). Results are means ± SEM (**P < 0.01). Statistical analyses were determined by two-tailed Student’s t test. (D and E) Transmission electron microscopy of the peripheral wing nerves containing peripheral neurons of the anterior wing margin. Quantification shows the total axon number at (E) 5 d.p.e. upon neuronal (nSyb-GAL4) overexpression of UAS-LacZ or UAS-Wg::HA (n = 5 each genotype) and the same genotypes at 25 d.p.e. (UAS-LacZ, n = 4; UAS-Wg::HA, n = 5). Results are means ± SEM (**P < 0.01). Statistical analyses were determined by two-tailed Student’s t test. Scale bars, 1 μm.