
Image
|
Figure Caption
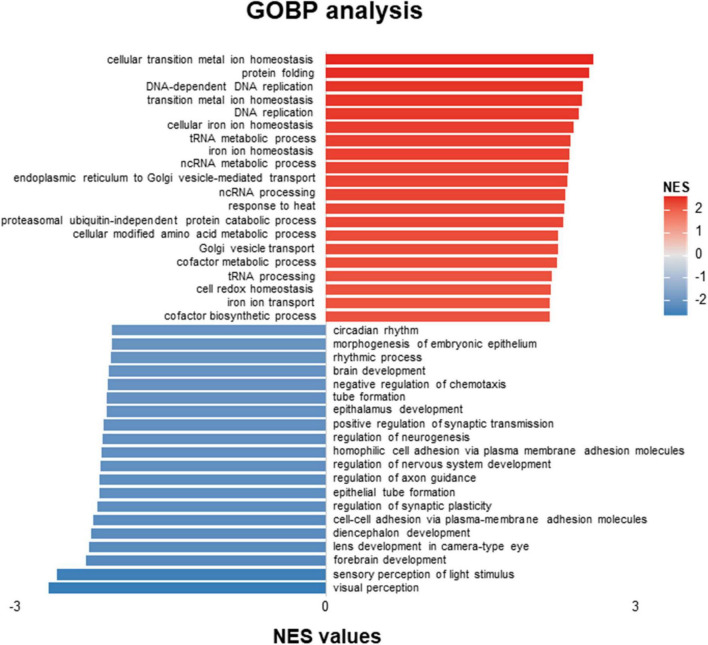
FIGURE 2
GOBP-analysis of RNA-Seq data showed patterns distinguishing acrolein (ACR) treated zebrafish from controls. Top twenty up-regulated and down-regulated pathways based on GOBP enrichment analysis of RNA-Seq results in WT and WT & ACR zebrafish larvae at 5 dpf. GOBP, Gene Ontology Biological Process; dpf, day post fertilization.
Acknowledgments
This image is the copyrighted work of the attributed author or publisher, and
ZFIN has permission only to display this image to its users.
Additional permissions should be obtained from the applicable author or publisher of the image.
Full text @ Front. Neurosci.