
Fig. 2
- ID
- ZDB-IMAGE-230129-9
- Publication
- Tomasello et al., 2021 - 16pdel lipid changes in iPSC-derived neurons and function of FAM57B in lipid metabolism and synaptogenesis
- All Figures
- Figures for Tomasello et al., 2021
|
Fig. 2
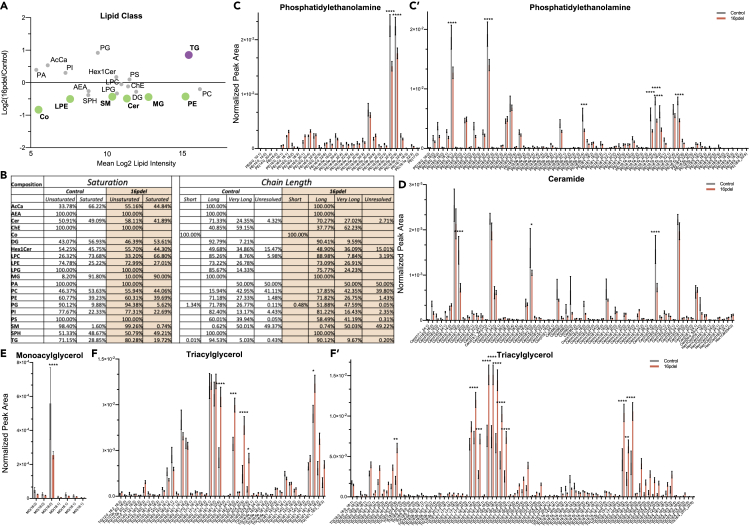
Significant lipid changes between control and 16pdel differentiated neurons
(A) Total log2 fold change from normalized peak area of lipid class analysis from untargeted lipidomics. Bolded and colored indicate statistically significant changes by T test, p ≤ 0.05–0.0001. AcCa acyl carnitine, AEA N-arachidonoylethanolamine, Cer ceramide, ChE cholesterol ester, Co coenzyme, DG diacylglycerol, Hex1Cer hexosylceramide, LPC lysophosphatiylcholine, LPE lysophosphatiylethanolamine, LPG lysophosphatiylglycerol, MG monoacylglycerol, PA phosphatidic acid, PC phosphatidylcholine, PE phosphatidylethanolamine, PG phosphatidylglycerol, PI phosphatidylinositol, PS phosphatidylserine, SM sphingomyelin, SPH sphingosine, TG triacylglycerol.
(B) Total lipid composition analysis from untargeted lipidomics between control and 16pdel neuron. Chain Length: Small 1–5, Medium 6–12, Long 13–21, Very Long 22+, and Unresolved.
(C–F) Selected analysis of lipid species from untargeted lipidomics classes. Lipid Class specified for each histogram (c - phosphatidylethanolamine, (D) ceramide, (E) monoacylglycerol, (F) triacylglycerol) normalized peak area between control (gray) and 16pdel (orange). Statistical analysis by two-Way ANOVA, ∗p ≤ 0.05 ∗∗p ≤ 0.01,∗∗∗p ≤ 0.001, ∗∗∗∗p ≤ 0.0001. Control n = 10, 16pdel n= 69, error bars represent SEM. TG and PE long and very long chain species not shown as no significant differences were found by ANOVA. Technical experimental replicates n = 3.