
Fig. 7
- ID
- ZDB-IMAGE-230129-14
- Antibodies
- Publication
- Tomasello et al., 2021 - 16pdel lipid changes in iPSC-derived neurons and function of FAM57B in lipid metabolism and synaptogenesis
- All Figures
- Figures for Tomasello et al., 2021
|
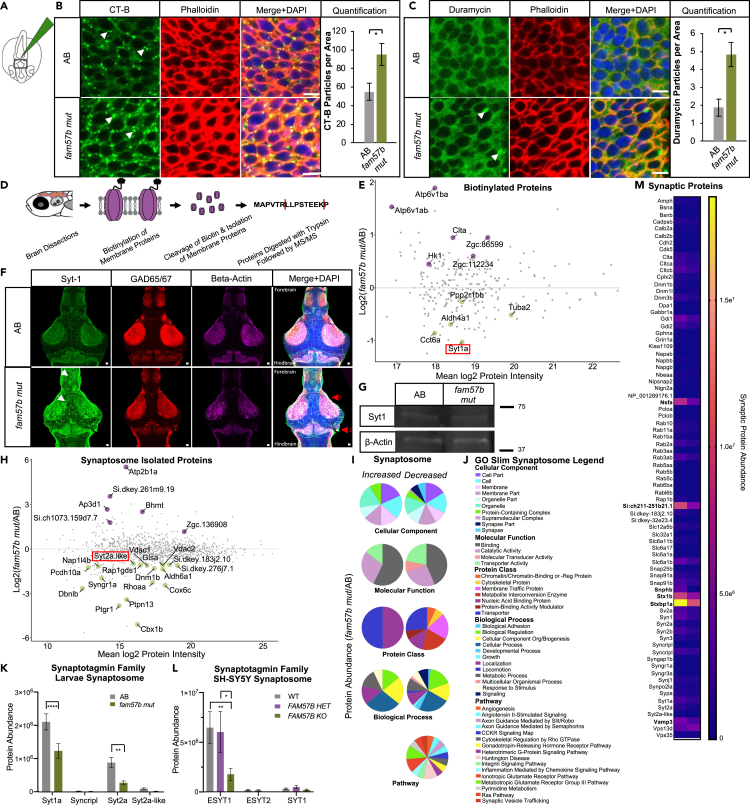
Fig. 7
Loss of fam57b results in altered plasma membrane architecture early in development and decreased localization of Synaptotagmin family at the synapse later in development
(A) Schematic of Cholera toxin-B-488 (CT-B) injection into hindbrain ventricle of embryo and flat-mounted midbrain region for imaging at 24 hpf.
(B) Representative embryo midbrain imaging and quantification of CT-B labeling of AB compared to fam57b mut. Punctate CT-B labeling (arrows), actin marker phalloidin indicates labeling of CT-B at the plasma membrane, merged with DAPI. Quantification of puncta between WT (gray) and fam57b mut (green) CT-B (p ≤ 0.05) ttest. Scale bar = 5 μm. AB n = 16, fam57b mut n = 18. Error bars SEM, statistical analysis by ttest ∗p ≤ 0.05. Technical experimental replicates n = 4.
(C) Representative embryo midbrain imaging and quantification of Duramycin-488 labeling of AB compared to fam57b mut. Punctate Duramycin labeling (arrows), actin marker phalloidin indicates labeling of Duramycin at the plasma membrane, merged with DAPI. Quantification of puncta between WT (gray) and fam57b mut (green) Duramycin PE staining (p ≤ 0.05) ttest. Scale bar = 5 μm. AB n = 8, fam57b mut n = 8. Error bars SEM, statistical analysis by ttest ∗p ≤ 0.05. Technical experimental replicates n = 3.
(D) Schematic of membrane protein labeling biotinylation assay and processing for MS/MS in 7 dpf larvae brains.
(E) Larvae brain total plasma membrane protein abundance changes between fam57b mut relative to AB (Log2 Fold). Statistically significant p ≤ 0.05–0.0001 proteins labeled, indicating increased (purple) or decreased (green) abundance. Lowest abundance membrane protein Synaptotagmin-1a (red box). n = 3 per genotype.
(F) Representative slice of 7 dpf whole larva brain mount with Sytaptotagmin-1a (green), GAD65/67 (red) and Beta-actin (magenta). z stack composite image merged with DAPI. Forebrain and midbrain areas of diffused Syt-1 localization (white arrows). Anatomical differences noted throughout brain, including (1) optic tectum and (2) corpus cerebelli (red arrows). Scale bar = 10 μm. Technical experimental replicates n = 2.
(G) Representative 7 dpf whole brain Western blot indicate no significant change in total Syt-1a protein levels between fam57b mut relative to AB. Zebrafish larvae brains pooled (20 per genotype). Syt-1a protein abundance normalized to Beta-Actin loading control, repeated twice.
(H) Larvae brain total isolated synaptosome protein abundance changes between fam57b mut relative to AB (Log2 Fold). Statistically significant p ≤ 0.05–0.0001 proteins labeled, indicating increased (purple) or decreased (green) abundance. Low abundance Synaptotagmin-2a like protein (red box). n = 7 per genotype. Technical experimental replicates n = 2.
(I and J) Gene ontology analysis of statistically significant larvae synaptosome isolated proteins (H) in fam57b mut relative to AB. (I) Gene ontology pie graphs of increased and decreased protein groups of cellular components, molecular function, protein classes, biological processes and pathways. (J) Gene ontology figure legend.
(K) Analysis of Synaptotagmin family members from larvae isolated synaptosomes. Significantly decreased protein abundance of Syt1a and Syt2a by two-Way ANOVA, ∗∗p ≤ 0.01, ∗∗∗∗p ≤ 0.0001.
(L) Analysis of Synaptotagmin family members from differentiated SH-SY5Y isolated synaptosomes between all 3 genotypes. Significantly decreased protein abundance of elongated ESYT1 by two-Way ANOVA, ∗p ≤ 0.05, ∗∗p ≤ 0.01. Error bars SEM.
(M) Analysis of synaptic markers from larvae isolated synaptosomes. Significantly decreased protein abundance (bolded) of vesicle regulation machinery and glutamate receptor activity by two-Way ANOVA, ∗∗p ≤ 0.01, ∗∗∗∗p ≤ 0.0001.