
Fig. 6
- ID
- ZDB-IMAGE-230129-13
- Publication
- Tomasello et al., 2021 - 16pdel lipid changes in iPSC-derived neurons and function of FAM57B in lipid metabolism and synaptogenesis
- All Figures
- Figures for Tomasello et al., 2021
|
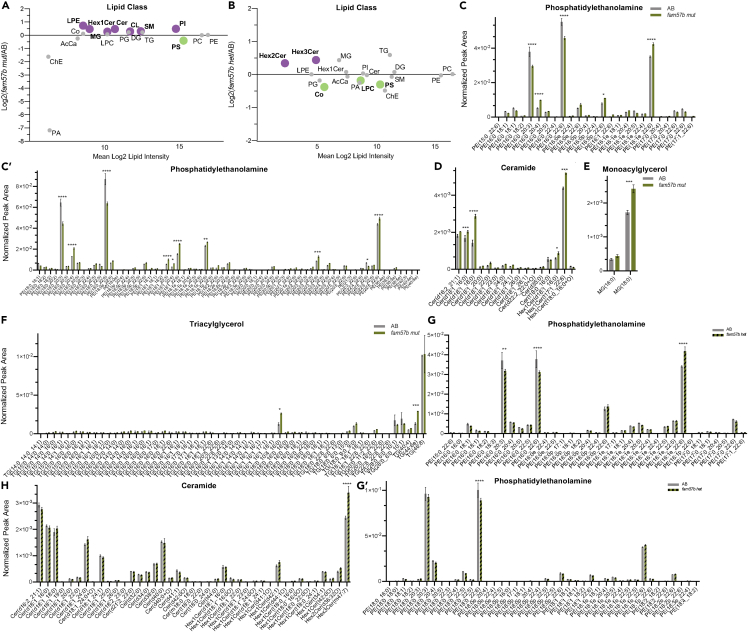
Fig. 6
Significant lipid changes in ceramides and glycerols between AB and fam57b mut brain tissue
(A) Total log2 fold change from normalized peak area of lipid class analysis from untargeted lipidomics. Bolded and colored indicate statistically significant changes by ttest, p ≤ 0.05–0.0001. AcCa acyl carnitine, Cer ceramide, ChE cholesterol ester, CL cardiolipin, Co coenzyme, DG diacylglycerol, HexCerHexosylceramide, LPC lysophosphatiylcholine, LPE lysophosphatiylethanolamine, MG monoacylglycerol, PC phosphatidylcholine, PE phosphatidylethanolamine, PG phosphatidylglycerol, PI phosphatidylinositol, PS phosphatidylserine, SM sphingomyelin, TG triacylglycerol. Technical experimental replicates n = 3.
(B–H) Selected analysis of lipid species from untargeted lipidomics classes. Lipid Class specified for each histogram, normalized peak area between AB (gray) and fam57b mut (green). Statistical analysis by two-Way ANOVA, ∗p ≤ 0.05 ∗∗p ≤ 0.01,∗∗∗p ≤ 0.001, ∗∗∗∗p ≤ 0.0001. AB n = 3, fam57b mut n= 3, error bars represent SEM. Experiment repeated twice, analysis was similar between two separate runs. Individual MG species between fam57b het to AB n.s. Not shown for space: two-Way ANOVA analysis of TG. Increase in TG (16:0_16:0_16:1) in fam57b het compared to AB (p ≤ 0.01).