
|
Fig. 5
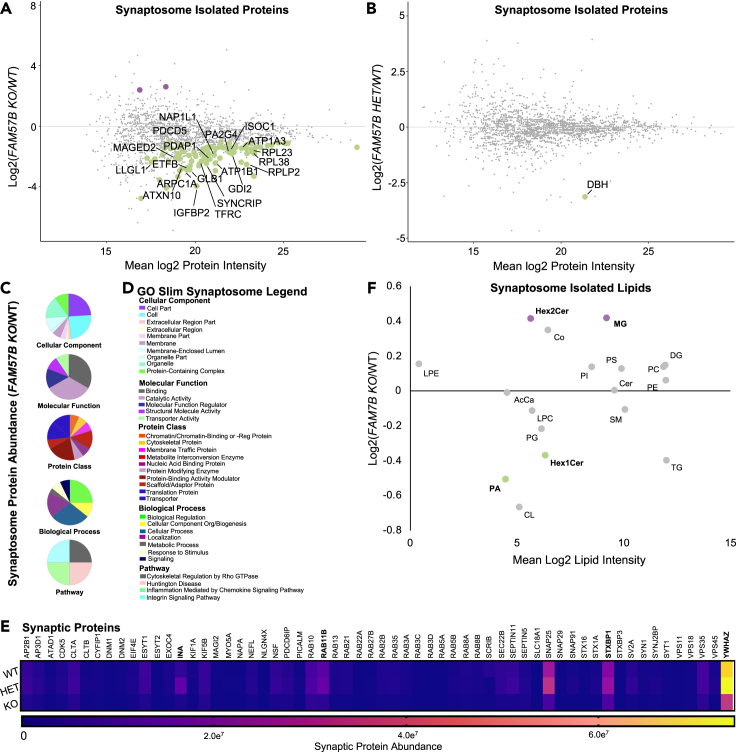
FAM57B knockout human neurons indicate altered synaptic composition
(A and B) Isolated synaptosome protein abundance changes between (A) FAM57B KO relative to WT and (B) FAM57B HET relative to WT (Log2 Fold). Labeled and colored indicating increased (purple) or decreased (green) abundance. Only the top 20 proteins of statistical significance were labeled in A and analyzed in C-E. WT n = 8, HET n = 10, KO n = 7. Technical experimental replicates n = 3.
(C–E) Gene ontology analysis of statistically significant synaptosome isolated proteins (E) in FAM57B KO relative to WT. (E) gene ontology pie graphs of top 20 decreased protein groups of cellular components, molecular function, protein classes, biological processes and pathways.(F) gene ontology figure legend.
(G) Analysis of synaptic markers from isolated synaptosomes between all 3 genotypes. Bolded are significantly decreased protein abundance of synaptic structural and maturation proteins, and vesicle regulation machinery. INA – WT - HET & WT - KO, RAB11B – HET - KO, STXBP1 – WT - HET & WT - KO, YWHAZ – WT - HET & WT - KO. two-Way ANOVA, p ≤ 0.05–0.0001.
(F) Isolated synaptosome lipid abundance between FAM57B KO relative to WT. Bolded text and color (purple increased and green decreased) indicates statistically significant changes by ttest, p ≤ 0.05–0.01. n = 6 per genotype, technical experimental replicates n = 2. No statistically significant differences observed when comparing FAM57B HET to WT, nor FAM57B KO to FAM57B HET.