
Image
|
Figure Caption
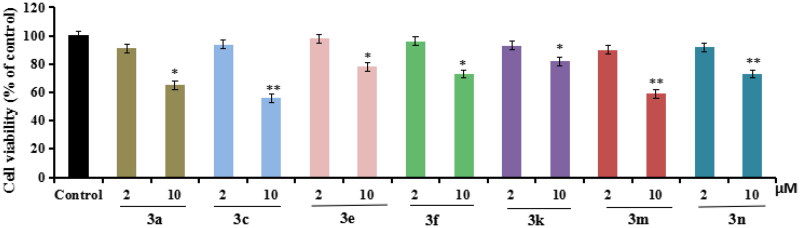
Figure 3.
The cell viability of compounds 3a, 3c, 3e, 3f, 3k, 3m, and 3n on the BV-2 cells, which was determined using MTT assay. The data are expressed as the mean ± SD by three independent experiments.
Acknowledgments
This image is the copyrighted work of the attributed author or publisher, and
ZFIN has permission only to display this image to its users.
Additional permissions should be obtained from the applicable author or publisher of the image.
Full text @ J Enzyme Inhib Med Chem