
|
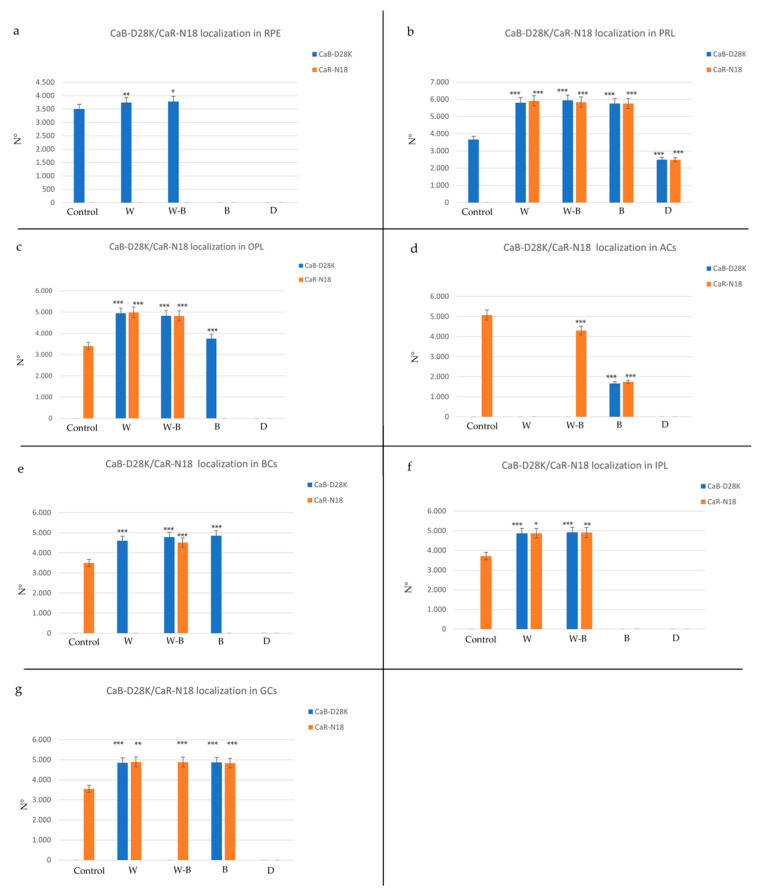
Figure 4
Graphical representation of immunopositivity of: (a) retinal pigment epithelium (RPE), (b) photoreceptor layer (PRL), (c) outer plexiform layer (OPL), (d) amacrine cells (ACs), (e) inner plexiform layer (IPL), (f) bipolar cells (BCs), (g) ganglion cells (GCs) detected by Calbindin (CaB-D28K) and Calretinin (CaR-18N) in different experimental groups. Experimental conditions: control (natural photoperiod), white light with a 34.8% of blue light emission (W), white–blue light with a 54.6% of blue light emission (WB), blue light with an 84.3% of blue light emission (B) and darkness (D). The statistical analysis shows a different distribution pattern of the two proteins between the experimental groups compared to the control. Data represent the average of measurements from the ten sections from each treatment. Statistical significance: *** p < 0.001, ** p < 0.01, * p < 0.05.