
|
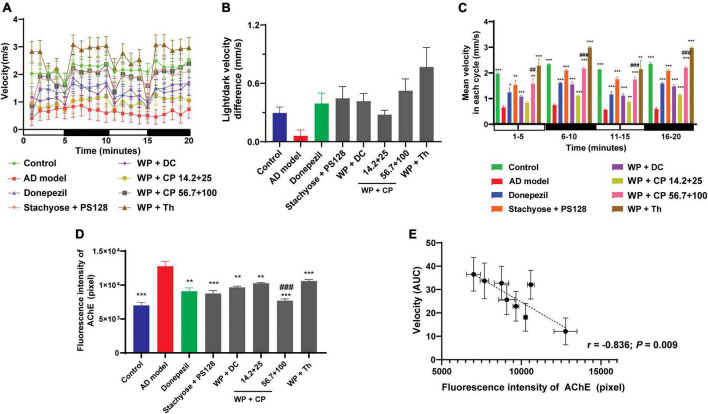
FIGURE 4
Memory-improving effects of nutrients. (A) The lines represented the average moving speed of zebrafish per minute under light and in dark environments for 20 min (n = 12). (B) The difference in velocity in light (0–5 and 10–15 min) and dark (5–10 and 15–20 min) was measured (n = 12). (C) The histogram of zebrafish’s average movement velocity in each cycle (5 min per cycle, n = 12). (D) The fluorescence intensity of AChE in each group (n = 6). (E) The intensity of AChE was plotted against the AUC of the mean velocity from panel (A) (n = 6, r = –0.836, P = 0.009). Data in panels (B,C) were presented as mean ± SEM. *P < 0.05, **P < 0.01, ***P < 0.001 compared with AD model; ##P < 0.001, ###P < 0.001 compared with WP + CP (14.2 + 25 μg/ml). Data were collected from three biological replicates.