
|
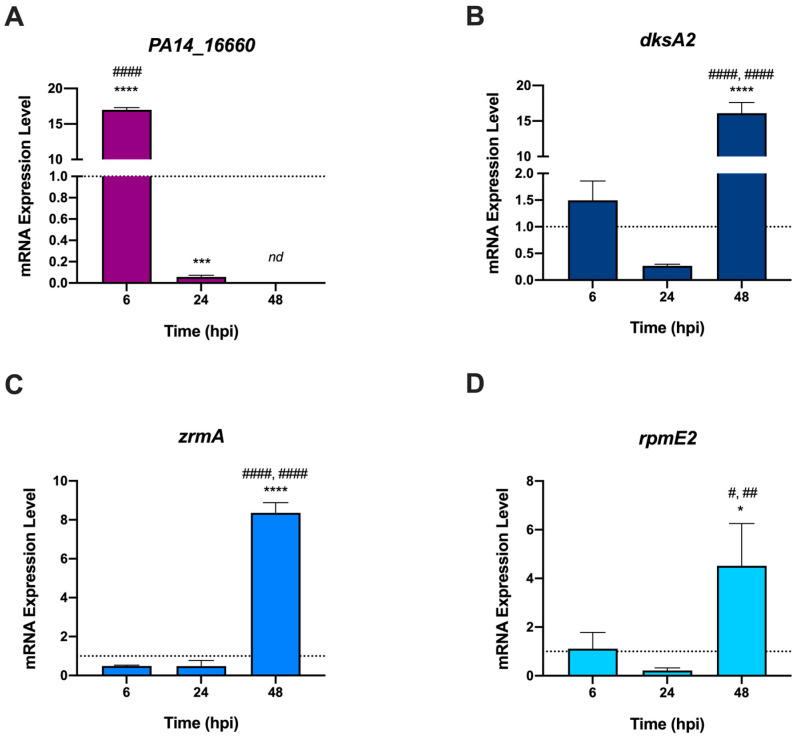
Figure 4
Expression levels of P. aeruginosa genes from infected zebrafish. RT-PCR was performed on bacterial mRNA extracted from zebrafish at 6, 24, and 48 hpi. The dotted line at Y = 1 represents the expression level of the genes in bacteria grown in LB medium (control). Data are means ± SD of three independent experiments, and statistical analyses were performed by ordinary one-way ANOVA and Bonferroni’s multiple comparison test. Asterisks show statistical differences versus bacteria grown in LB medium (**** p < 0.0001; *** p < 0.0005; * p < 0.05), hash signs show statistical differences between samples at the different hpi (#### p < 0.0001; ## p < 0.001; # p < 0.05); nd: not detected.