
Image
|
Figure Caption
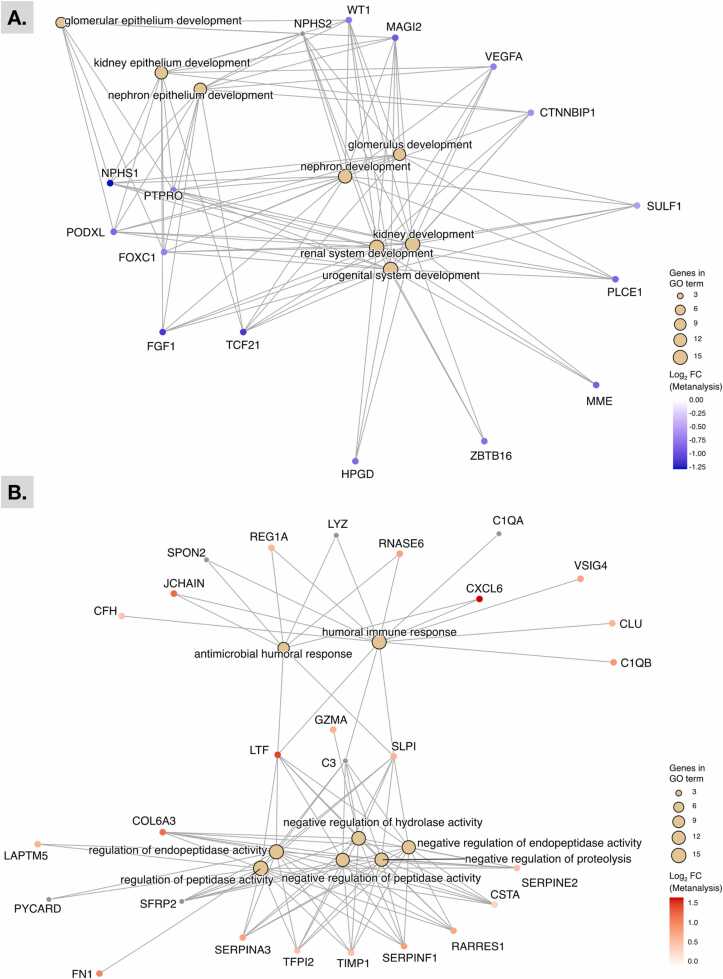
Fig. 4
Gene-concept network plot comparing the functional profiles of DEGs in human DN kidney tissue samples compared with healthy controls. Shown are the top 8 gene-ontology terms assigned to genes from the first/downregulated (A) and second/upregulated (B) hierarchical cluster groups produced in
Acknowledgments
This image is the copyrighted work of the attributed author or publisher, and
ZFIN has permission only to display this image to its users.
Additional permissions should be obtained from the applicable author or publisher of the image.
Full text @ Comput Struct Biotechnol J