
Fig. 7
- ID
- ZDB-IMAGE-230120-27
- Publication
- Munjal et al., 2021 - Extracellular hyaluronate pressure shaped by cellular tethers drives tissue morphogenesis
- All Figures
- Figures for Munjal et al., 2021
|
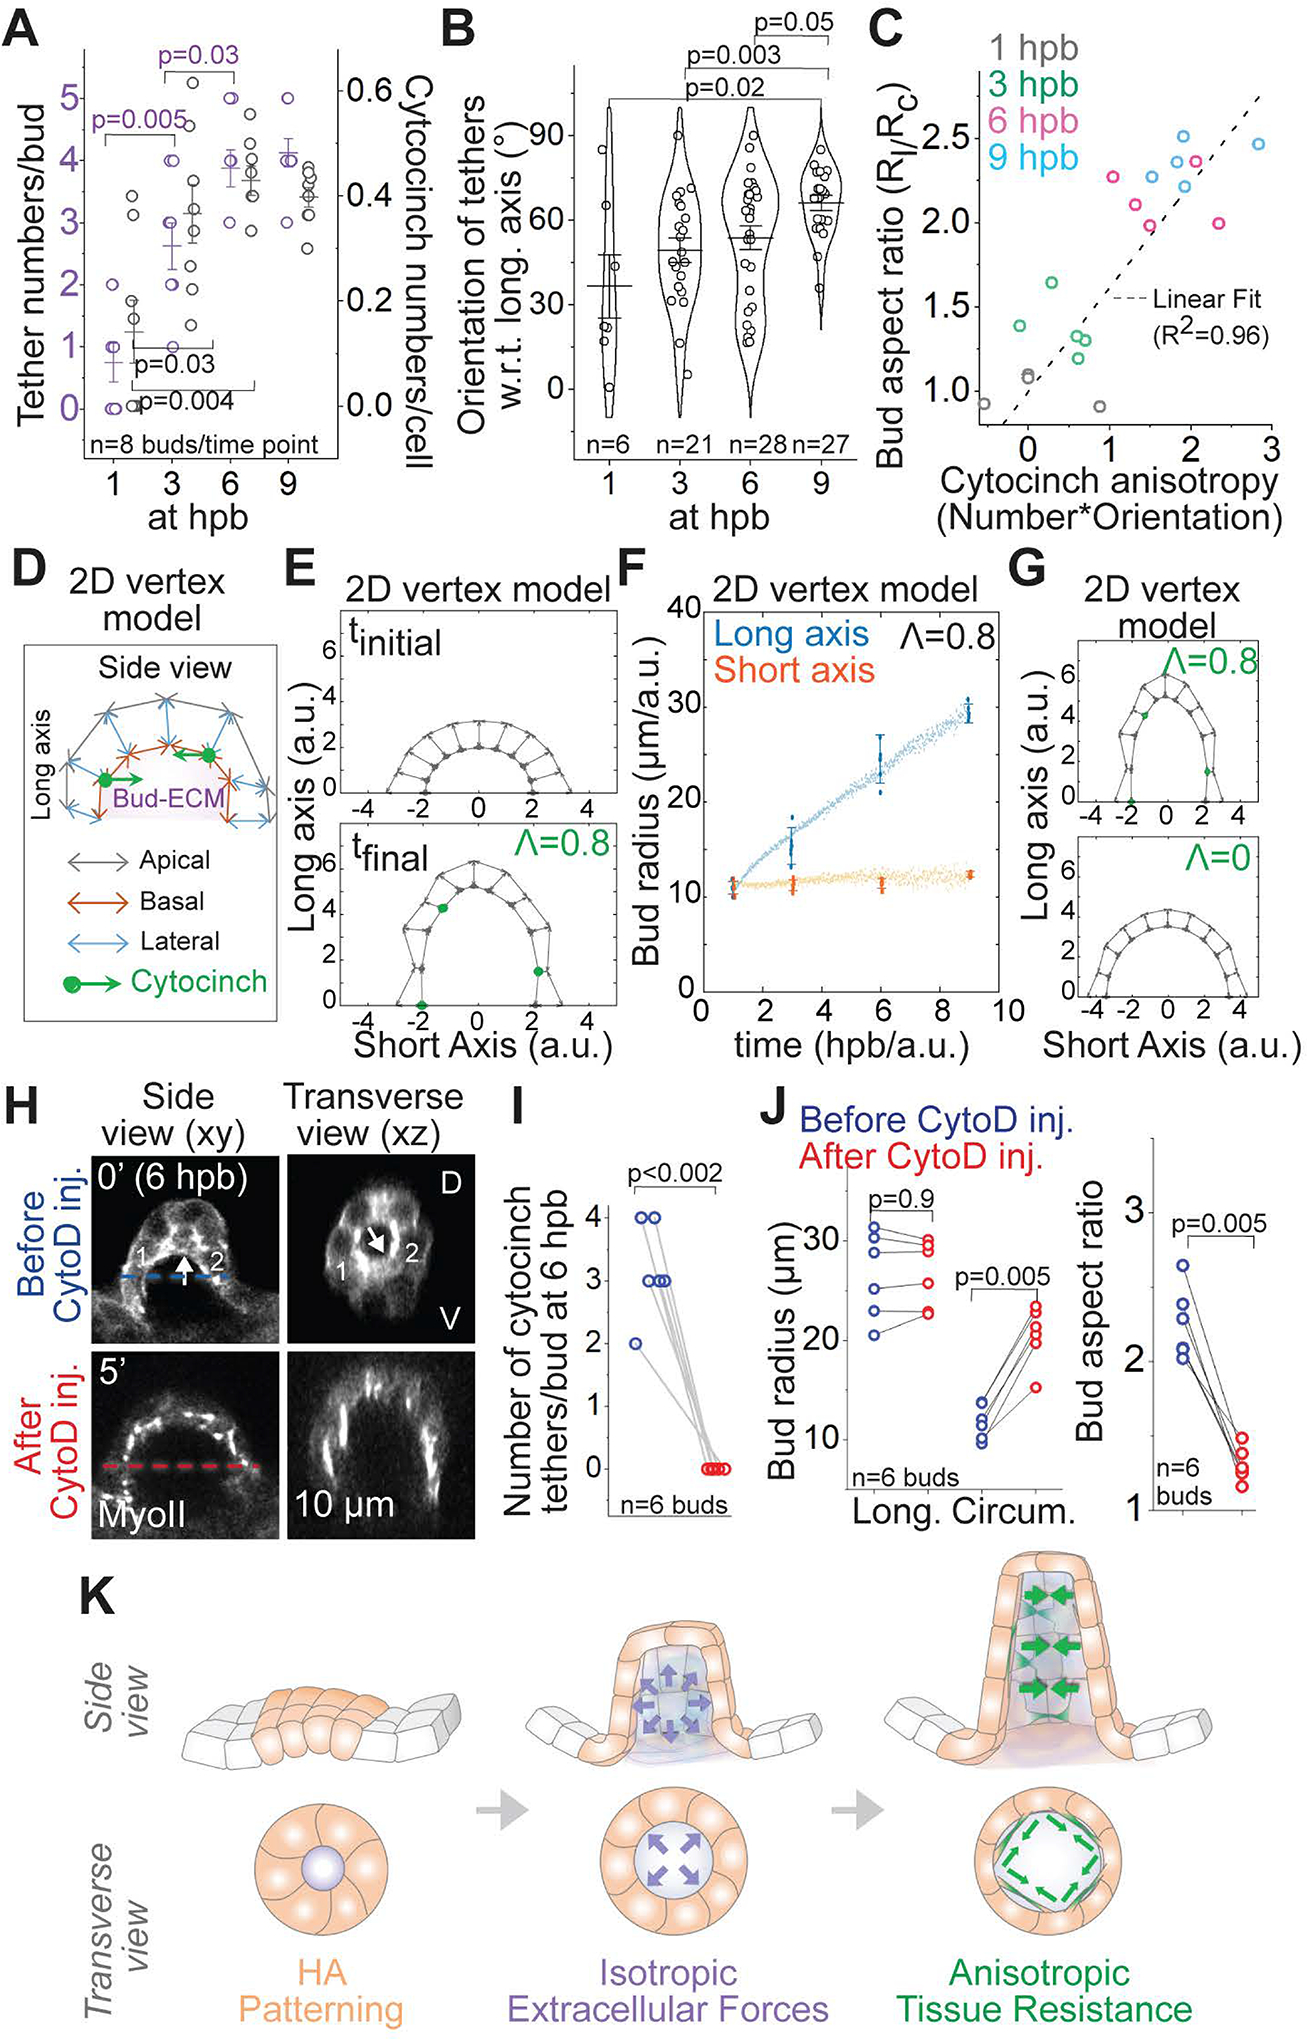
Fig. 7
(A) Individual data points and mean±s.d. of the number of tethers per bud (left axis, purple) and the number of cytocinches per cell (right axis, gray) at given time points. ‘n’ denotes the number of buds. p values as labelled (Mann Whitney- U test).
(B) Individual data points, mean± s.d. and violin plot of cytocinch tether orientation measured with respect to (w.r.t) the longitudinal bud axis at given time points. ‘n’ denotes the number of tethers. p values as labelled (Mann Whitney- U test).
(C) Bud aspect ratio plotted as a function of cytocinch anisotropy (number*orientation) at different stages. Grey line is a linear fit with R2=0.96.
(D) Schematic of the 2D vertex model with apical, lateral and basal surface tension, enclosing a prescribed bud-ECM volume, with addition of inward forces from circumferential cytocinches (Λ).
(E) Equilibrium configurations of a bud section, using the 2D vertex model (n=10 cells, grey arrows for basal, lateral and apical surfaces and green dots for cytocinches) at 1 hpb (Λ=0) and 9 hpb (Λ=0.8/cytocinch).
(F) Predicted evolution of bud radii in the long (blue) and short (orange) axes (experimental: big dots, predictions: little dots) assuming the experimentally observed increase of bud-ECM volume and cytocinch fraction in time.
(G) 2D vertex model configuration with (Λ=0.8) and without (Λ=0) cytocinches.
(H) 2D sections of an anterior bud at 6 hpb using Myosin II reporter before and after Cytochalasin D (CytoD 1mM) treatment. Cytocinch is marked by white arrow before treatment. Cytocinch is lost after CytoD treatment. Before (blue) and after (red) circumferential bud diameter is labelled.
(I and J) Number of cytocinch tethers per bud (I), bud radii and aspect ratios (J) before and after CytoD treatment. ‘n’ denotes the number of buds. p values as labelled (Mann Whitney- U test).
(K) Illustration of the mechanism underlying budding morphogenesis for SCC formation. Patterned cells in the OV (in orange) synthesize HA. HA drives budding through isotropic extracellular forces (in purple). Anisotropic resistance from cytocinches (in green) mediate anisotropic bud extension.
Reprinted from Cell, 184, Munjal, A., Hannezo, E., Tsai, T.Y., Mitchison, T.J., Megason, S.G., Extracellular hyaluronate pressure shaped by cellular tethers drives tissue morphogenesis, 6313-6325.e18, Copyright (2021) with permission from Elsevier. Full text @ Cell