
Fig. 3
- ID
- ZDB-IMAGE-230120-16
- Publication
- Gulluni et al., 2021 - PI(3,4)P2-mediated cytokinetic abscission prevents early senescence and cataract formation
- All Figures
- Figures for Gulluni et al., 2021
|
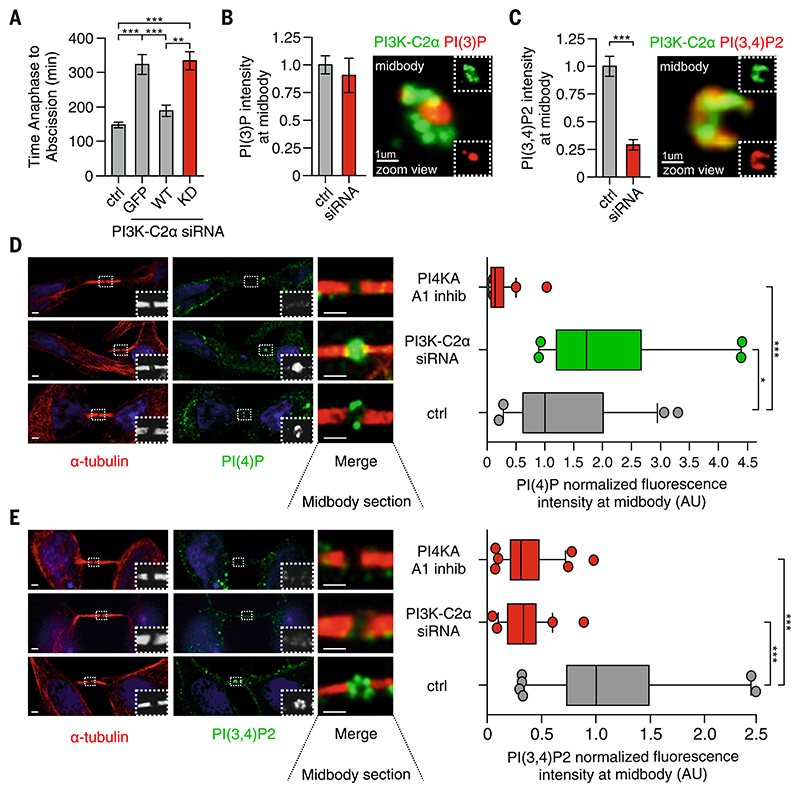
Fig. 3
(A) Time-lapse microscopy measuring the time required to progress from anaphase to abscission in HeLa cells treated with siRNA for PI3K-C2α alone or expressing GFP and siRNA-resistant GFP–wild-type (WT) or GFP-kinase inactive (KD) form of PI3K-C2α. n ≥ 25 cells imaged. (B) (Left) Quantification of PI(3)P levels at midbody by means of immunofluorescence staining (n ≥100 cells) and (right) confocal image of 3D reconstructed midbody stained for PI(3)P (red) and PI3K-C2α (green). (C) (Left) Quantification of PI(3,4)P2 levels at midbody by immunofluorescence staining (n ≥100 cells) and (right) confocal image of 3D reconstructed midbody stained for PI(3,4)P2 (red) and PI3K-C2α (green). (D) Quantification of PI(4)P levels at midbody in control, A1 inhibitor, and siRNA-treated cells. n ≥100 cells, mean ± SD. (E) Quantification of PI(3,4)P2 levels at midbody in control, A1 inhibitor, and siRNA-treated cells. n ≥100 cells, mean ± SD. If not previously specified, all results are shown as mean or representative picture of at least three independent experiments ± SEM. *P < 0.05; **P < 0.01; ***P < 0.001.