
|
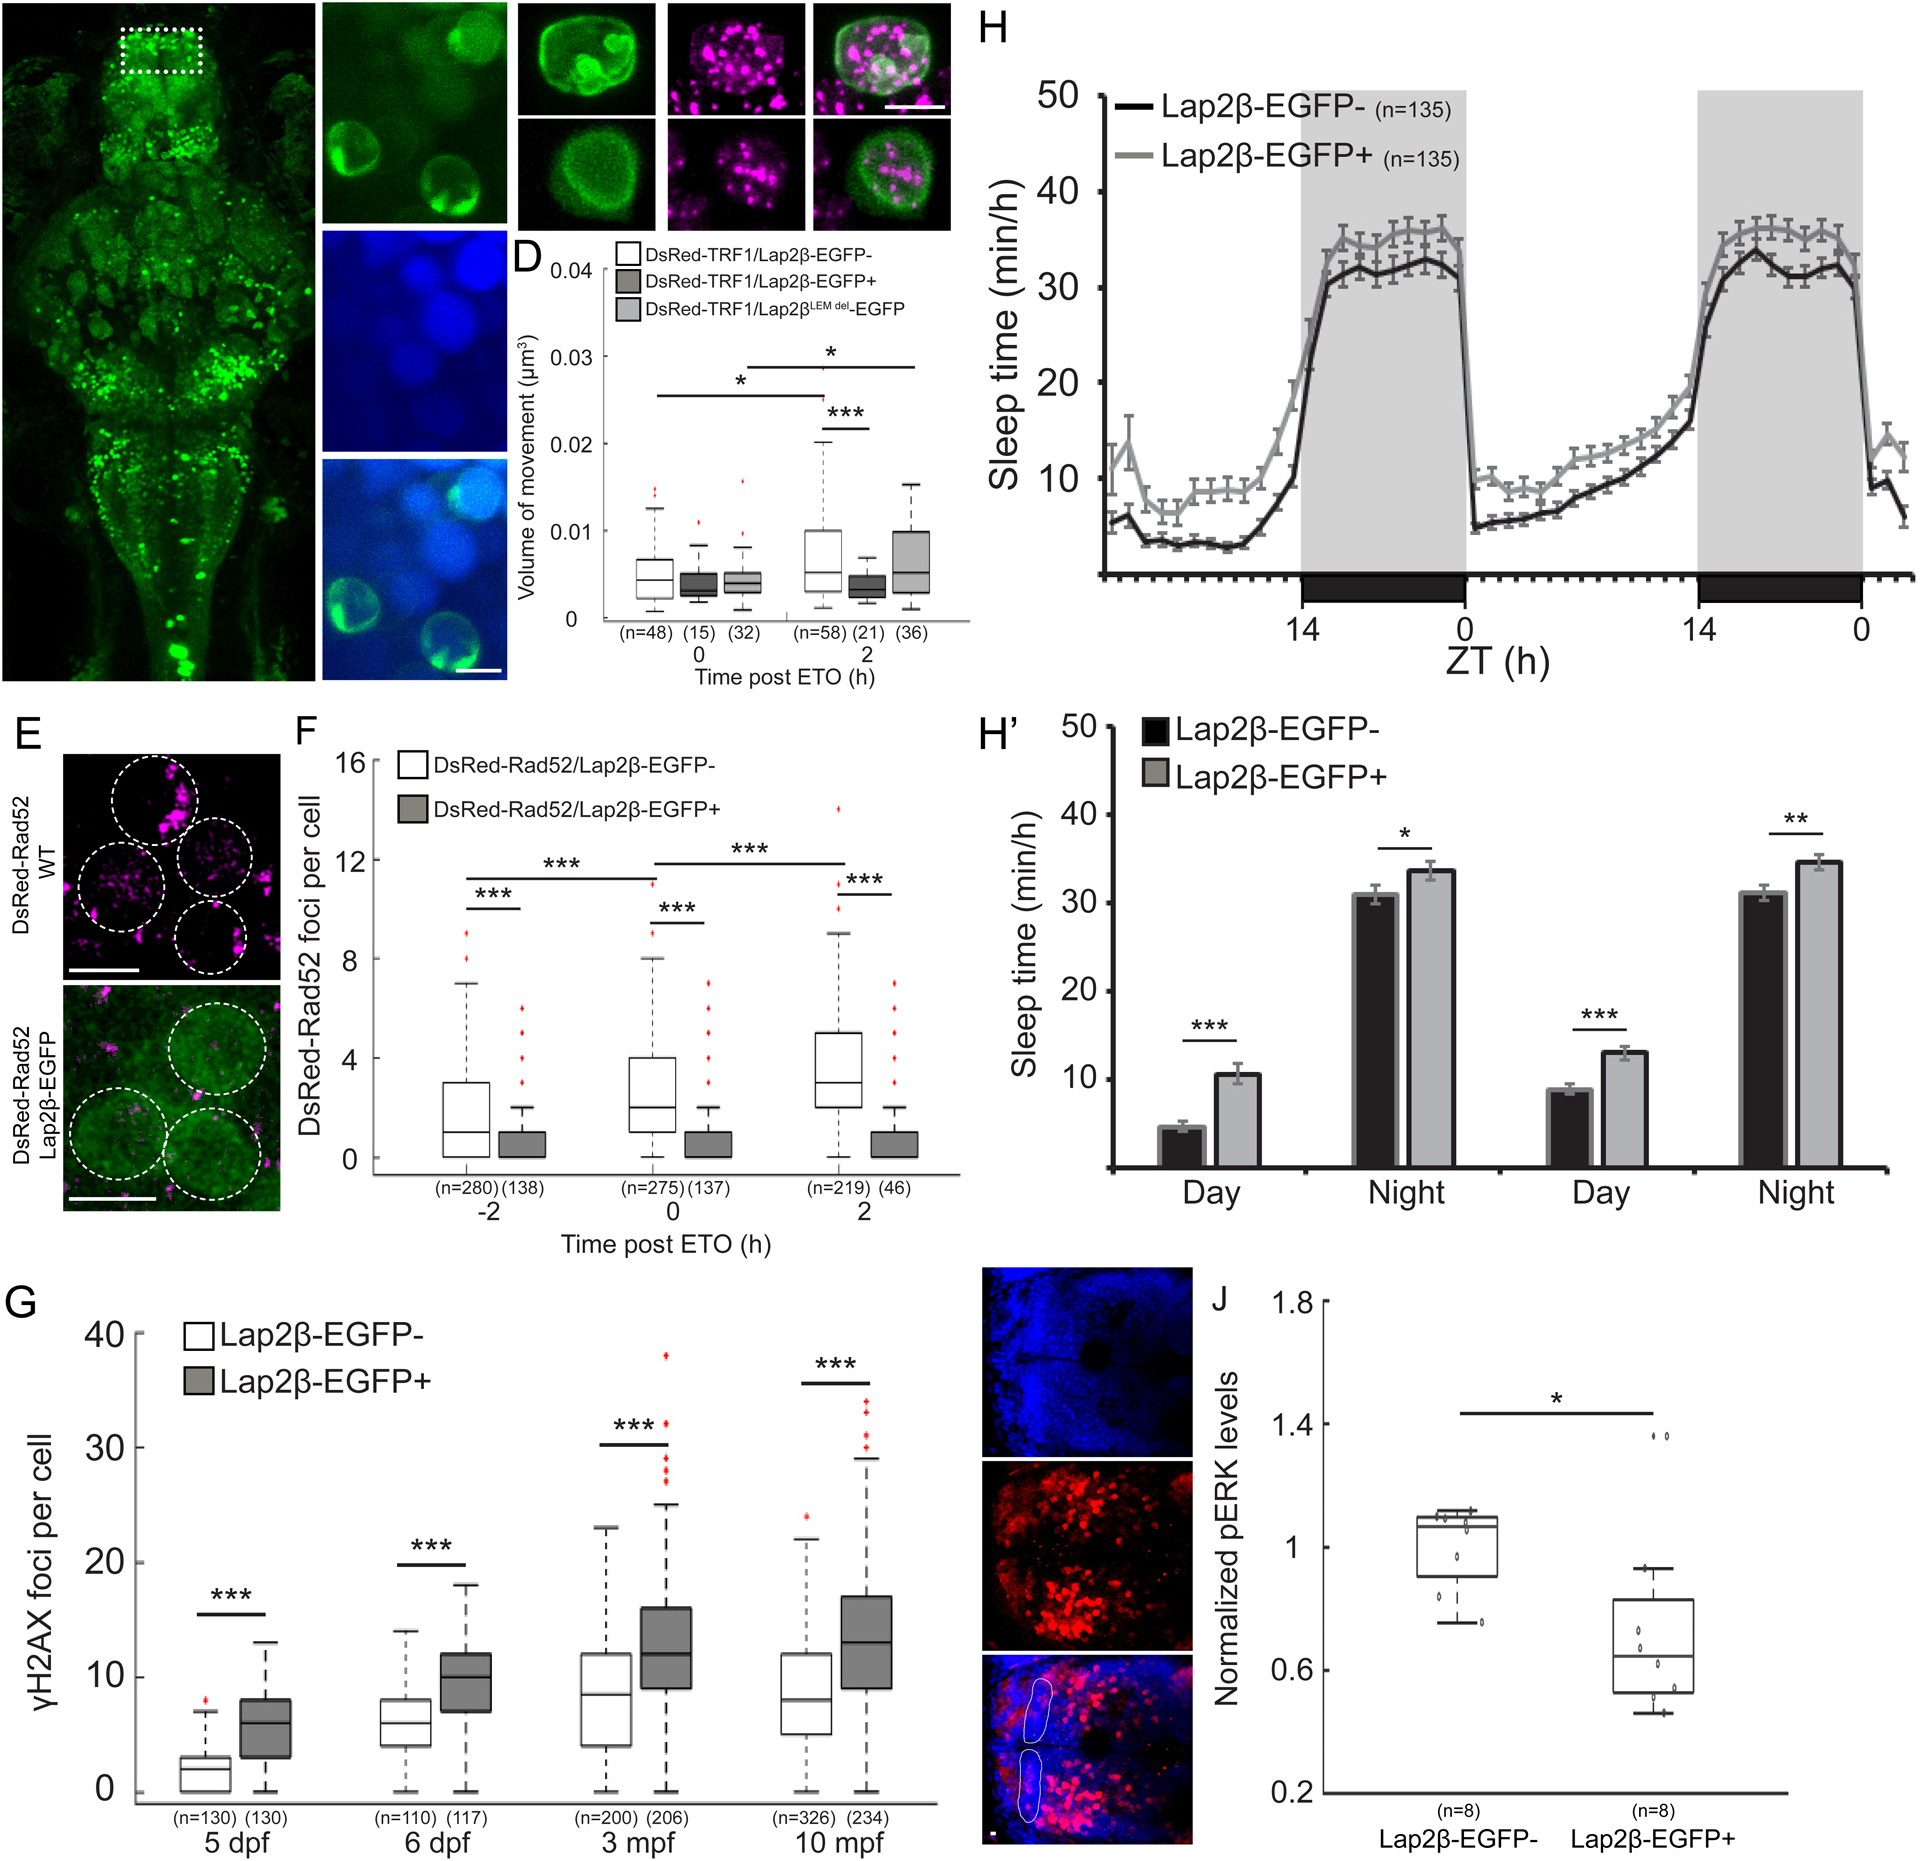
Fig. 4
A. Dorsal view of 6 dpf tg(HuC:Gal4/uas:Lap2β-EGFP) larvae (Lap2β-EGFP+). Dashed box shows the dorsal pallium (DP). MB- midbrain, Rh- rhombencephalon. B. Representative image of Lap2β-EGFP expression in the nuclei. C. Co-expression of Lap2β-EGFP (green, upper panel) or Lap2βLEMdel-EGFP (green, lower panel) and chromosome marker (DsRed-TRF1, magenta) in the nucleus of DP neurons. D. Volume of chromosome dynamics during 5 min in neurons of the DP immediately and 2 h after ETO treatment. E. Neurons of the DP that express either DsRed-Rad52 or both DsRed-Rad52 and Lap2β-EGFP. F. The number of DsRed-Rad52 foci in the DP of 6 dpf larvae 2 h before, immediately after, and 2 h after ETO treatment. G. The levels of DNA damage in larvae and adult brains. H. H’. Sleep of 5–6 dpf larvae under a 14 h light/ 10 h dark cycle. H’. The average sleep time during the day and the night. I. Dorsal view (head points to the left) of the brain of 6 dpf larvae stained with α-pERK (red) and DAPI (blue). Dashed area marks the DP. J. Average pERK expression in single neurons of the DP of 6 dpf siblings. *p < 0.05, **p < 0.01, ***p < 0.001, two-tailed t-test: two samples assuming unequal variance (D, G-J), two-way ANOVA followed by Tukey’s test (F). Data show mean ± SEM (H, H’), or boxplots (D, F, G, J). Red crosses indicate outliers. n=number of animals (H, J) or cells (D, F, G). ZT-zeitgeber time. Scale bar = 5 μm.