
|
Fig. 1
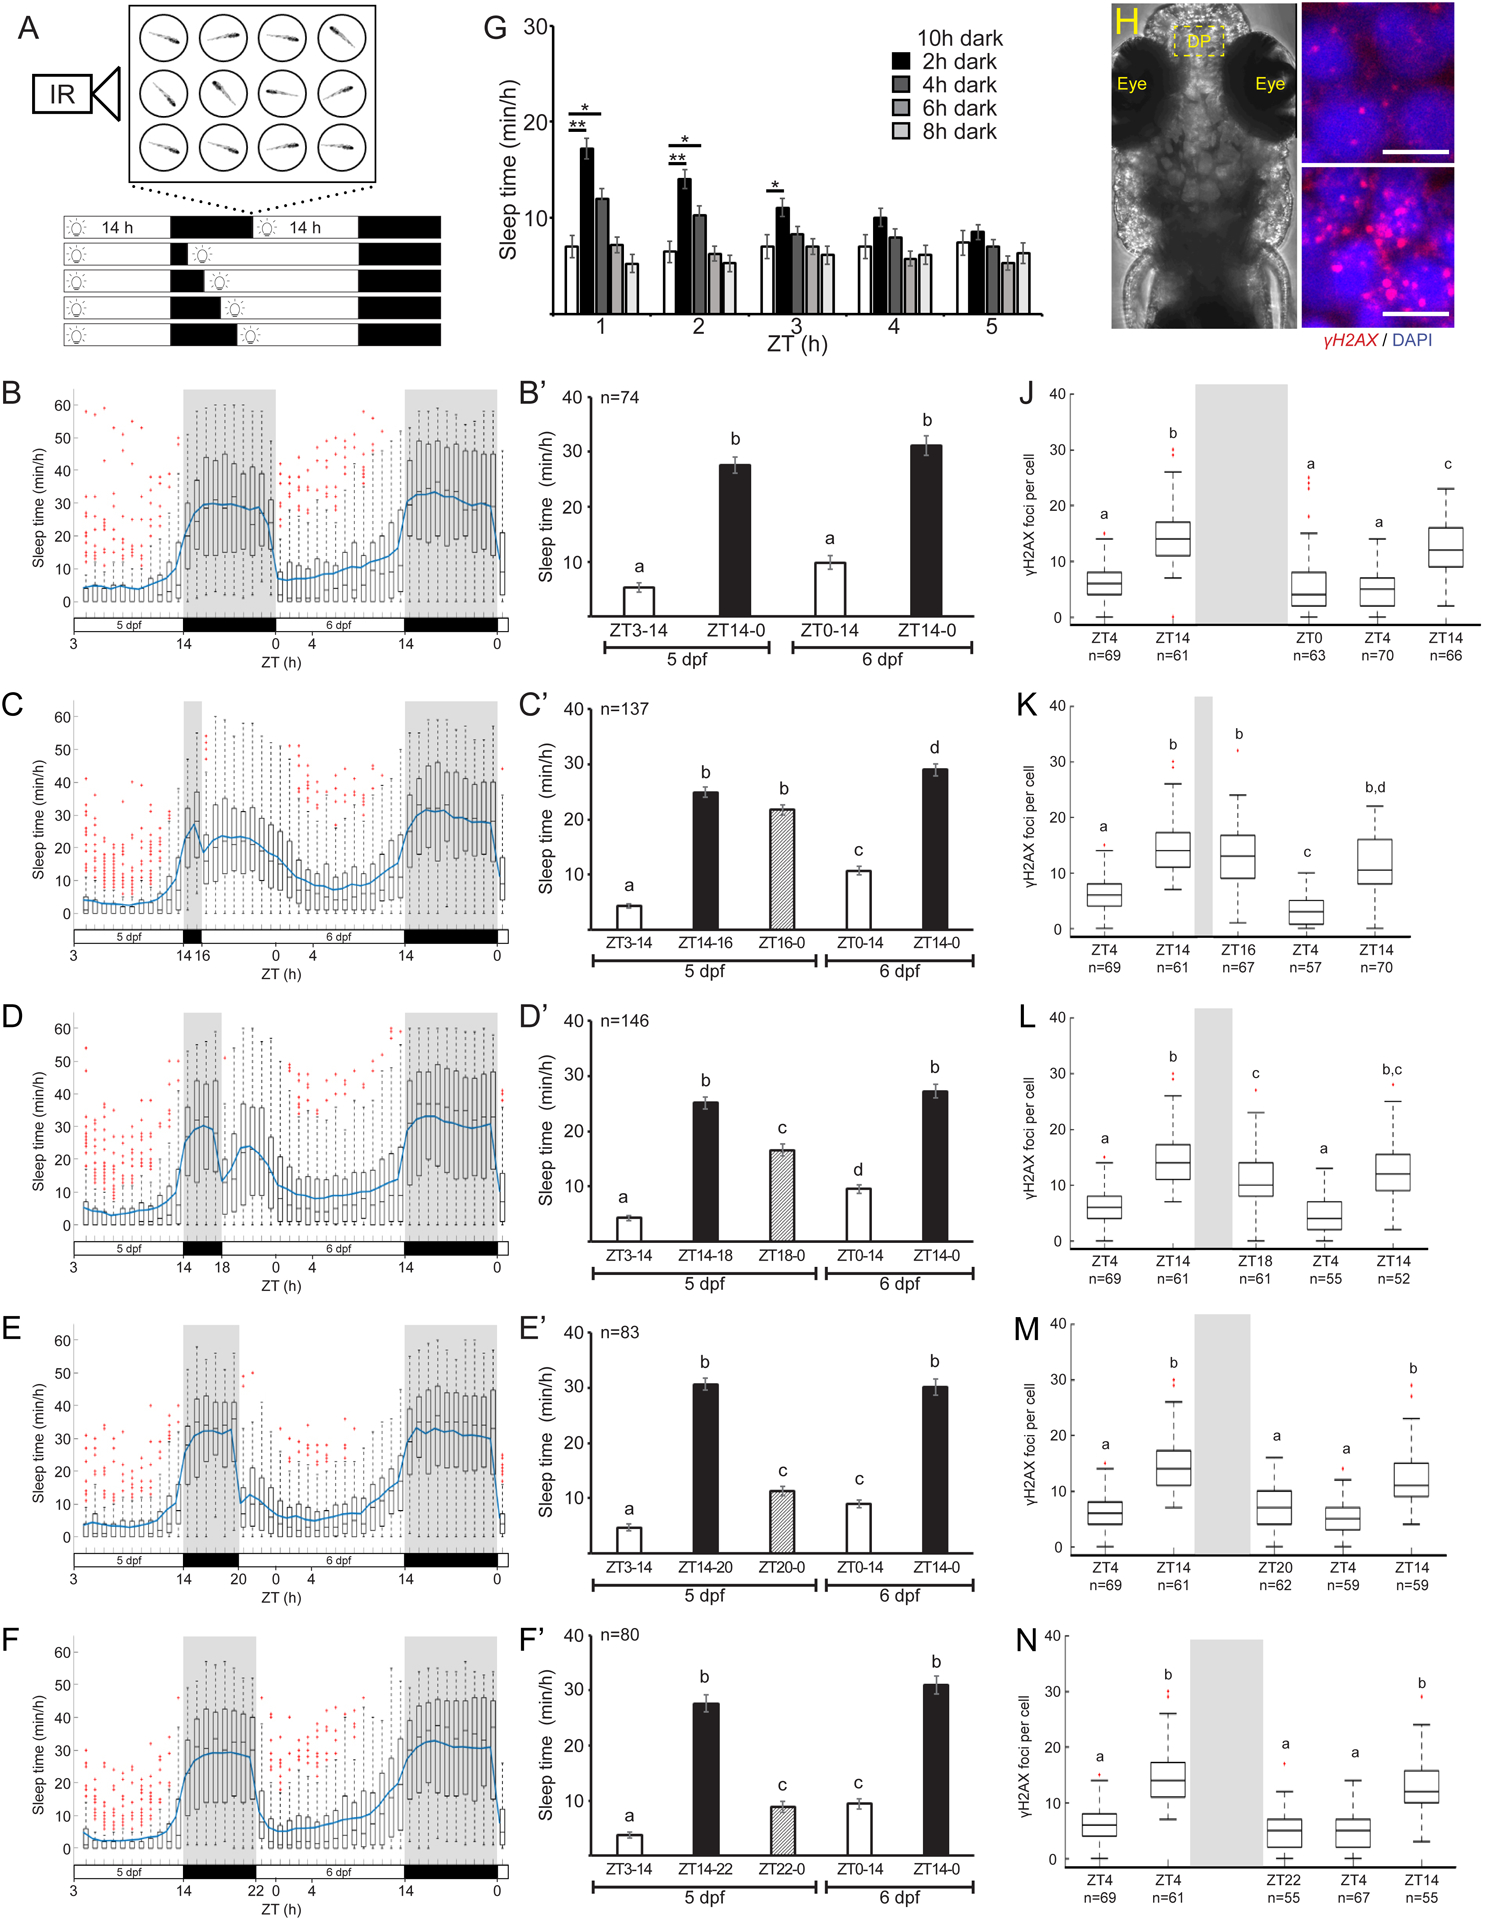
A. Schematic illustration of the experimental procedure. Sleep was monitored under various light/dark regimes. B-F’. Sleep of 5–6 dpf larvae under an 14 h light/ 10 h dark cycle (B, B’, p = 8×10−40), 14 h light/ 2 h dark cycle (C, C’, p = 3×10−94), 14 h light/ 4 h dark cycle (D, D’, p = 4×10−66), 14 h light/ 6 h dark cycle (E, E’, p = 1×10−83), 14 h light/ 8 h dark cycle (F, F’, p = 2×10−59). The bar charts represent the average sleep time for each time bin. G. Average sleep time of all groups in the first 5 h of the 2nd day. *p < 0.05, **p < 0.01, two-tailed t-test: two samples assuming unequal variance. H. Dorsal view of 6 dpf larvae. Dashed box showing the dorsal pallium (DP) area analyzed in J-N. I. Representative neuron nuclei stained with DAPI and γH2AX in the DP during the morning (ZT4) and the end of the day (ZT14). Scale bar = 5 μm. J-N. The levels of DNA damage in single neuronal nuclei over 34 h. All time points were compared to the baseline levels of the first day (5 dpf). J. 14 h light/10 h dark cycle, p = 1.9×10⁻³⁵. K. 14 h light/ 2 hr dark cycle, p = 1.8×10−39. L. 14 h light/ 4 h dark cycle, p = 2.2×10⁻³³. M. 14 h light/ 6 h dark cycle, p = 8.1×10−38. N. 14 h light/ 8 h dark cycle, p = 4.5×10−44. Letters indicate significant differences (p < 0.05), one-way ANOVA followed by Tukey’s test (B’-F’, J-N). Data show means ± SEM (B’-F’, G) or boxplots (B-F, J-N). Blue line represents mean. Red crosses indicate outliers. n=number of animals (B’-F’) or cells (J-N). ZT–zeitgeber time.