
|
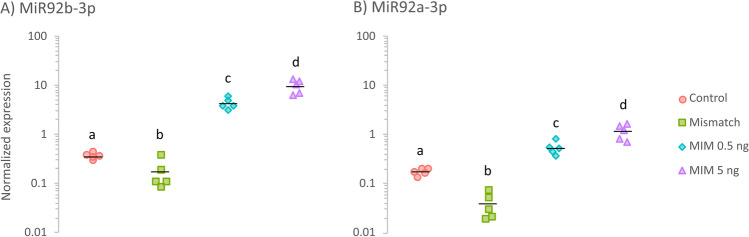
Fig. 7
Relative expression of A MiR92b-3p and B MiR92a-3p in zebrafish larvae (at 72 hpf) that received intra-yolk microinjections of MiR92b-3p mimic at 0.5 ng/embryo (MIM 0.5 ng; cyan diamonds) or 5 ng/embryo (MIM 5 ng; violet triangles), those that received C. elegans MiR39-3p mimic at 5 ng/embryo (mismatch; green squares), or those that were not treated with microinjections (control; red circles). Individual points represent values from individual Petri dishes used for incubation (i.e., replicates; n = 5 per each group). Black horizontal lines indicate means, and different letters indicate statistically significant differences between group means (one-way independent ANOVA followed by Tukey’s HSD test; p < 0.05)