
|
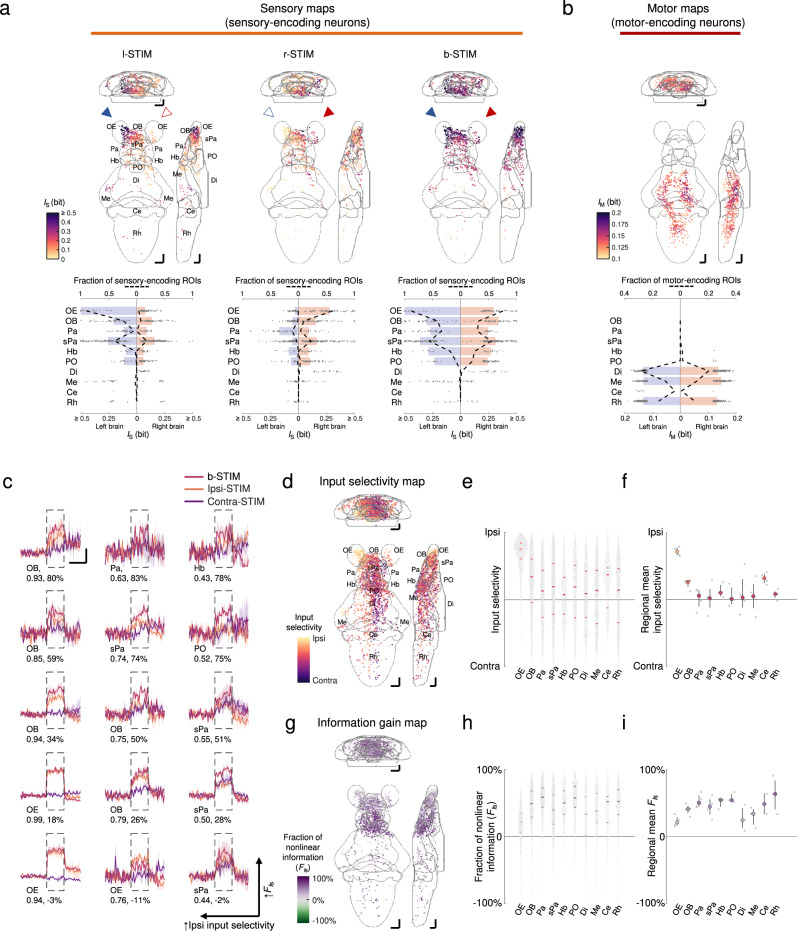
Fig. 5 a Upper panels: mean intensity projections (to coronal, transverse, and sagittal planes) of the mutual information between the calcium signals of regions-of-interest (ROIs) and stimulus profile of l-STIM (left panel), r-STIM (middle panel) or b-STIM (right panel) (IS), from an example larva. Solid triangles mark the corresponding OP(s) stimulated. Lower panels: corresponding brainwide IS distributions. Dashed lines indicate sensory-encoding ROI fractions. Bars represent the medians in regions with top six fractions of sensory-encoding ROIs with b-STIM. Abbreviations of brain regions: same as in Fig. 3e. b Upper panel: mean intensity projections of mutual information between the calcium signals of ROIs and tail flipping frequency (IM) from the larva in a. Lower panel: corresponding brainwide IM distribution. Dashed lines indicate motor-encoding ROIs fractions. Bars represent the medians in regions with top three fractions of motor-encoding ROIs. a, b The numbers of sensory-encoding and motor-encoding ROIs are 676 and 763, respectively. c Example trial-averaged responses to ipsilateral (ipsi-STIM, orange), contralateral (contra-STIM, violet), or bilateral (b-STIM, cherry) olfactory stimulation (n = 3 trials for each case) of individual ROIs from the designated brain regions with a range of ipsilateral-contralateral input selectivity (first number) and fraction of nonlinear information (FIs) (second number). Shadow shows SEMs. Dashed rectangle indicates stimulus window. Scale bars: 10 seconds (horizontal) and 0.5 normalized dF/F (vertical). Data from the same larva shown in a. d Mean intensity projection maps of ipsilateral(Ipsi)-contralateral(Contra) input selectivity of sensory-encoding ROIs. e Brainwide Ipsi-Contra input selectivity distributions of individual ROIs. f Regional means of Ipsi-Contra input selectivity. g Mean intensity projection maps of FIs. h Brainwide FIs distributions of individual ROIs. i Regional means of FIs. d–i Data are pooled across larvae (n = 4). The number of ROIs in d and e is 2301, and that in g and h is 1232. e, f, h, i The colors are coded accordingly to the color scale bars in d and g, respectively. e, h Horizontal lines: medians, 75 and 25 percentiles. Shadows of the violin plots scale according to the probability density function. f, i Each small dot representing one larva’s value. Large dots, upper and lower limits of lines: medians, 75 and 25 percentiles, respectively. Scale bars in a, b, d, g 50 μm in Z-Brain atlas space. Source data are provided as a Source Data file.