
|
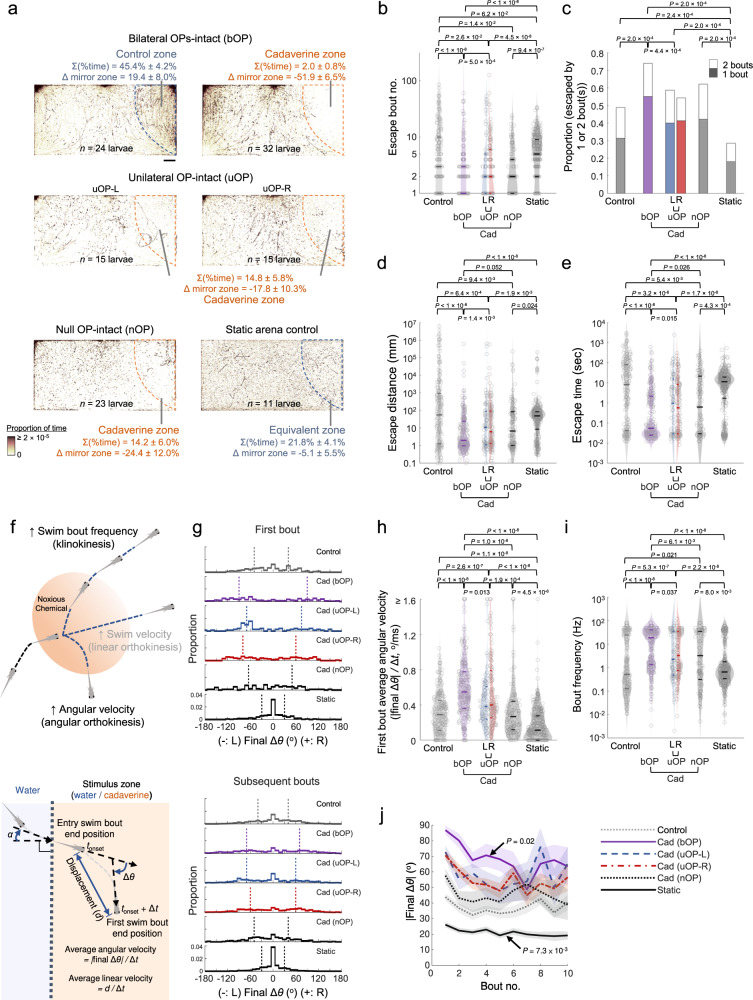
Fig. 4 a Upper panels: footprints of bilateral OP-intact (bOP) larvae in control and avoidance assays. Middle panels: footprints of unilateral OP-intact (uOP) larvae in avoidance assays. Lower panels: footprints of null OP-intact (nOP) larvae in avoidance assays and static arena control groups. Note that the static arena control group assays were carried out without flow. For each group, the rightmost (stimulus or water) zones are outlined by dashed lines. The percentages of time spent in the rightmost zone and their differences from that in the mirror water zone (Δ mirror zone) are shown (with SEMs across assays). Scale bar: 0.5 cm. b Bout number, c proportion of entry-to-exit events with only 1 or 2 bouts (P value: one-sided Chi-squared test with Tukey’s post-hoc test, comparing 2-bout event proportions), d distance traveled, and e time taken to escape the rightmost zone in control assays (Control: bOP larvae in the water-only arena with flow; Static: bOP larvae in water-only arena without flow) and avoidance assays (bOP larvae, left OP-intact (L) or right OP-intact (R) uOP larvae, and nOP larvae in arenas with cadaverine stream in the stimulus zone). f Upper panel: illustration of navigational strategies that may be adopted after encountering a noxious chemical. Lower panel: schematics of kinematic parameters that can be extracted. | | denotes absolute value. g Histograms of turn angle distributions of first (upper) and subsequent (lower) bouts (i.e., final Δθ). h First bout average angular velocity (i.e., |final Δθ|/Δt) upon entering the rightmost zone. i Swim bout frequency quantified from all rightmost zone entry-to-escape trajectories. j |Final Δθ| vs. bout number (line: mean; shadow: SEM) after rightmost zone entry. P value: two-sided Mann–Kendall trend test. b, d, e, i The parameters are plotted in log scales. In b, d, e, h and i Horizontal lines indicate the medians, 75 and 25 percentiles for each group. Shadows of the violin plots scale according to the probability density function. P values: Kruskal–Wallis test with Tukey’s post hoc test. In a–e and g–j, numbers of assays, larvae, and rightmost zone border-crossing events: bOP (control): 6, 24, 211; bOP (avoidance): 8, 32, 251; uOP-L: 4, 15, 71; uOP-R: 4, 15, 155; nOP: 7, 23, 96; bOP Static: 3, 11, 283. Source data are provided as a Source Data file.