
|
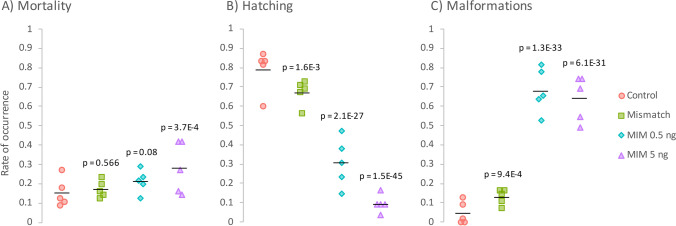
Fig. 1
A Mortality, B hatching, and C malformations in zebrafish larvae 72 h after intra-yolk microinjections of MiR92b-3p mimic at 0.5 ng/embryo (MIM 0.5 ng; cyan diamonds) or 5 ng/embryo (MIM 5 ng; violet triangles), or intra-yolk microinjections with C. elegans MiR39-3p mimic at 5 ng/embryo (mismatch; green squares) compared to untreated zebrafish larvae (control; red circles). Individual points show rate of occurrence in individual Petri dishes used for incubation (i.e., replicates; n = 5 per group). Black horizontal line indicates mean rate of occurrence. p values for the difference in the rate of occurrence between the control and exposed groups were calculated using logistic regression