Image
Figure Caption
Fig. 6
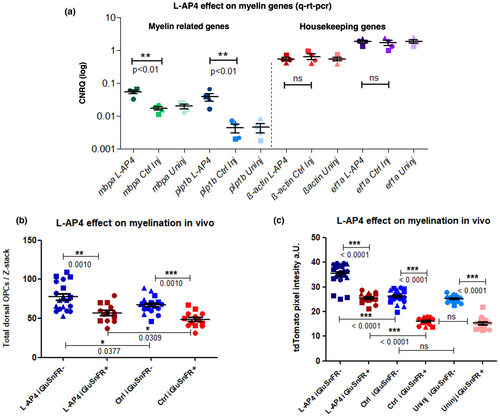
Treatment with the mGluR agonist L-AP4 increased myelin-related genes and rescues CNS myelination in iGluSnFR(+) zfl. (a) CNRQ values representing mRNA quantification of mbpa, plp1b, ß-actin, and ef1a isolated from 1mM L-AP4, sham vehicle-injected and untreated zfl (wild type) at 5 dpf (injected at 3 dpf). mRNA levels were normalized against ß-actin and ef1a housekeeping gene expression. Both myelin genes, mbpa and plp1b, show a significant increase in expression in L-AP4 injected zfl compared to sham-injected or uninjected control larvae. Both housekeeping genes though do not show any significant difference in L-AP4 versus sham-injected or uninjected controls. Data were evaluated by one-way ANOVA followed by Bonferroni's multiple comparisons. * indicates a p-value < 0.05; ** indicates a p-value < 0.01. Values show mean ± SEM. mbpa: L-AP4 versus Ctrl **p < 0.01; L-AP4 versus uninj. **p < 0.01; F = 18.60; df = 11 and plp1b: L-AP4 versus Ctrl **p < 0.01; L-AP4 versus uninj. **p < 0.01; F = 10.74; df = 11; ß-actin: L-AP4 versus Ctrl p = 0.6673; L-AP4 versus uninj.: p = 0.6673; F = 0.4233; df = 11 and ef1a: L-AP4 versus Ctrl p = 0.8338; L-AP4 versus uninj. p = 0.8338; F = 0.1855; df = 11. N = 4 independent experiments indicated by different shapes. (b) Two-photon in vivo microscopic images of Tg(Olig2:dsRed) proximal zfl spinal cords of 5 dpf larvae after L-AP4 ventricle injections at 3 dpf where analyzed in lateral view. For representative example images, please refer to Figure S6a. A significant increase in total dorsal OPCs after L-AP4 injection could be seen in iGluSnFR(−) zfl compared to sham-injected iGluSnFR(−) larvae. *p = 0.0377; unpaired two-tailed t test; t = 2.158. iGluSnFR(+) zfl at 5 dpf like before at 3 dpf (see Figure 2) showed a significant ***p = 0.001; unpaired two-tailed t test; t = 3.643 decrease in dorsal OPCs compared to iGluSnFR(−) zfl. Injection of 1mM L-AP4 at 3 dpf into the ventricle of iGluSnFR(+) zfl though could partly but significantly *p = 0.0309; unpaired t test; t = 1.959 rescue the OPC reducing effect of iGluSnFR at 5 dpf. Dot plot graphs show averages of dorsal OPC numbers (mean ± StDev). N = 3 independent experiments indicated by different shaped dots, with a total (n) of 13–19 larvae. (c) Low-resolution epi-fluorescence microscopic images of Tg(CaudinK:mem-TdTomato) proximal zfl spinal cords of 5 dpf larvae after L-AP4 or sham ventricle injections at 3 dpf where analyzed in lateral view. For representative example images, please refer to Figure S6b. A significant increase in tdTomato red myelin reporter fluorescence after L-AP4 injection could be seen in iGluSnFR(−) zfl compared to sham-injected iGluSnFR(−) larvae ***p < 0.0001; one-way ANOVA followed by Bonferroni's multiple comparisons; F = 82.24; df = 69. The same is true for a comparison with completely uninjected iGluSnFR(−) siblings. Control iGluSnFR(+) zfl at 5 dpf like before (see Figure 3c) showed a significant ***p < 0.0001; unpaired two-tailed t test; t = 9.378; decrease in tdTomato reporter fluorescence compared to control iGluSnFR(−) zfl. Injection of 1mM L-AP4 at 3 dpf into the ventricle of iGluSnFR(+) zfl though could completely and significantly ***p < 0.0001; rescue this myelin-reducing effect of iGluSnFR at 5 dpf; one-way ANOVA followed by Bonferroni's multiple comparisons; F = 172.2; df = 54. Dot plot graphs show averages of red tdTomato myelin reporter fluorescence (mean ± StDev). N = 3 independent experiments indicated by different shaped dots, with a total (n) of 15–17 larvae
Acknowledgments
This image is the copyrighted work of the attributed author or publisher, and
ZFIN has permission only to display this image to its users.
Additional permissions should be obtained from the applicable author or publisher of the image.
Full text @ J. Neurosci. Res.

