
Fig. 7
- ID
- ZDB-IMAGE-230111-7
- Genes
- Publication
- Nakagawa et al., 2021 - Mechanical role of actinotrichia in shaping the caudal fin of zebrafish
- All Figures
- Figures for Nakagawa et al., 2021
|
Fig. 7
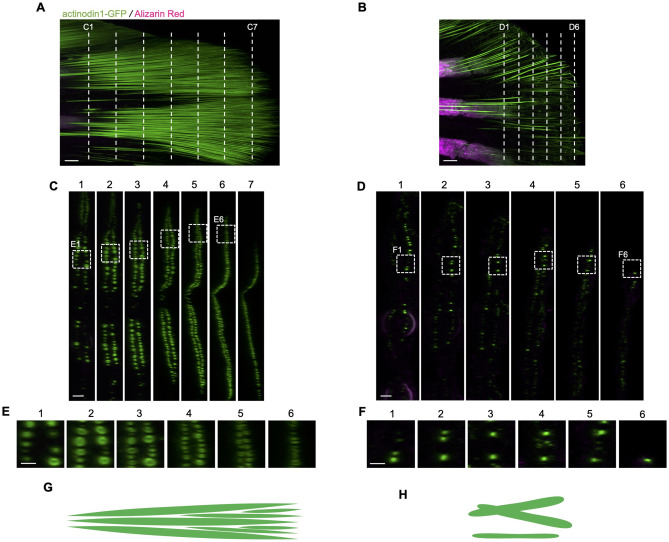
Fig. 7. Density and placement of actinotrichia at the tip of the fin in 3-week-old fish. (A, B) The actinotrichia of the fin tip in 3-wewk-old visualized with actinodin1-GFP (Kuroda et al., 2018). The fin-rays were visualized using Alizarin Red to set the starting point of transverse section. White dot lines in A and B indicate the positions of transverse sections in C, D, E, and F. (C, D) Transverse sections control (C) and col9a1c(-/-) (D). (E, F) Magnified images of white dashed boxes in C and D, respectively. The section interval was 40 μm in C and 20 μm in D. The same actinotrichia were chased from 1 to 6. (G, H) Schematic of actinotrichia arrangement in the fin deduced from the images of the sections. Scale bars: 20 μm in A, B; 10 μm in C, D; 5 μm in E, F.
Reprinted from Developmental Biology, 481, Nakagawa, H., Kuroda, J., Aramaki, T., Kondo, S., Mechanical role of actinotrichia in shaping the caudal fin of zebrafish, 52-63, Copyright (2021) with permission from Elsevier. Full text @ Dev. Biol.