
|
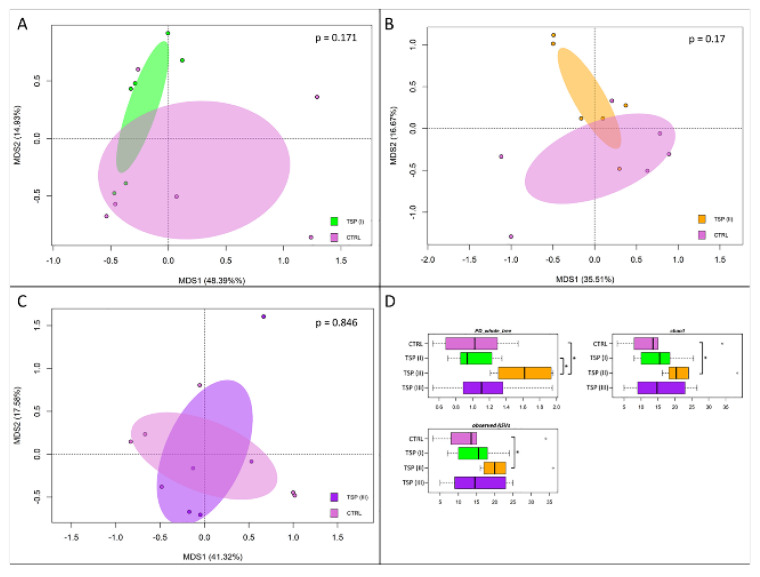
Figure 5 Beta diversity and alpha diversity of the gut microbiota of zebrafish fed a control diet (CTRL), zebrafish fed a diet supplemented with TSP at 0.9 g/kg of feed (TSP I), zebrafish fed a diet supplemented with TSP at 1.7 g/kg of feed (TSP II), and zebrafish fed a diet enriched with TSP at 3.4 g/kg of feed (TSP III). PCoA based on unweighted UniFrac distances between gut microbiota structures of CTRL zebrafish and TSP I (A), TSP II (B), and TSP III (C) zebrafish. In all PCoA plots, samples are not significantly separated (permutation test with pseudo-F ratio, p > 0.05). (D) Boxplots of alpha diversity, measured with Faith’s phylogenetic diversity (PD_whole_tree), Chao1 index, and observed_ASVs. For only the TSP II group, higher values of alpha diversity were observed for all metrics compared to the plant-based-diet group (Wilcoxon rank-sum test, * p ≤ 0.05).