
|
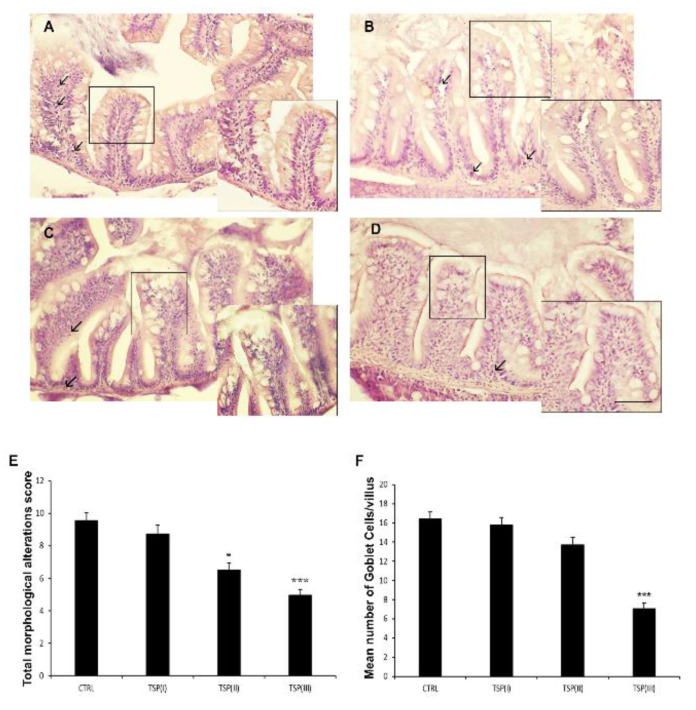
Figure 1 Hematoxylin and eosin (H&E) staining of intestines of (A) zebrafish fed a plant-based diet (control); (B) TSP I, zebrafish fed a plant-based diet supplemented with TSP at 0.9 g/kg of feed; (C) TSP II, zebrafish fed a plant-based diet supplemented with TSP at 1.7 g/kg of feed; and (D) TSP III, zebrafish fed a plant-based diet supplemented with TSP at 3.4g/kg of feed. Scale bar: 100 μm; 50 μm for the higher magnifications. Arrows indicate leucocyte infiltrates; linear boxes depict goblet cells. (E) Bar graph showing the total morphological alteration score (based on the modification of intestinal folds and gut lumen and increases in the numbers of goblet cells and leukocytes) defined for the intestines of each zebrafish group. Data are expressed as means ± SEs. * p < 0.05, *** p < 0.0001 compared to the control group. (F) Bar graph showing the mean number of goblet cells/villi in the intestines of each zebrafish group. Alcian Blue staining was used to count the goblet cells. Data are expressed as means ± SEs. *** p < 0.0001 compared to the control group.