
Figure 6
- ID
- ZDB-IMAGE-230110-144
- Publication
- Jim et al., 2022 - Pneumolysin promotes host cell necroptosis and bacterial competence during pneumococcal meningitis as shown by whole-animal dual RNA-seq
- All Figures
- Figures for Jim et al., 2022
|
Figure 6
Pneumococcal competence in zebrafish larvae with pneumococcal meningitis
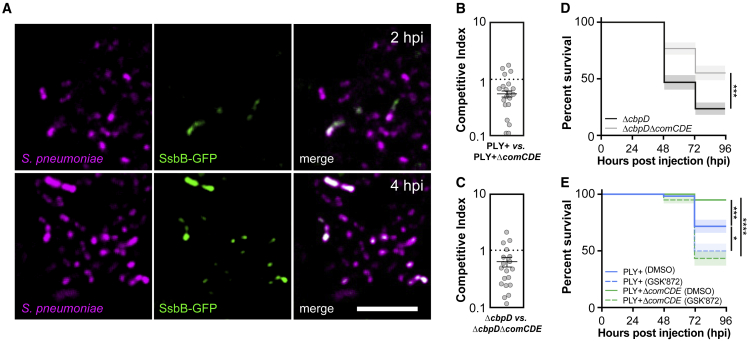
(A) Single-plane confocal microscopy images showing increased heterogeneous expression of SsbB-GFP over time in constitutively HlpA-mCherry-expressing pneumococci injected into the hindbrain ventricle of 2 dpf zebrafish larvae. Scale bar: 10 μm.
(B) Competitive index (CI) analysis of 2 dpf larvae co-injected with similar number of S. pneumoniae D39V PLY+ (HlpA-GFP) and S. pneumoniae D39V PLY+ ΔcomCDE (HlpA-mKate2) (B) and CI of larvae co-injected with similar number of S. pneumoniae D39V ΔcbpD and S. pneumoniae D39V ΔcbpDΔcomCDE.
(C) Larvae were harvested at 24 hpi. A CI score of 1 denotes no difference in virulence. The data represent the mean ± SEM of two biological replicates with 10 larvae per group; each dot represents a single larva; p < 0.0001, D39V PLY+ versus D39V PLY+ ΔcomCDE; p < 0.01, D39V ΔcbpD versus ΔcbpDΔcomCDE; determined by one sample t test.
(D) Survival curves of 2 dpf zebrafish larvae injected with 400 CFUs of S. pneumoniae D39V PLY+ or S. pneumoniae D39V PLY+ ΔcomCDE into the hindbrain ventricle. The data represent the mean ± SEM of three biological replicates with 20 larvae per group (n = 60 in total/group); ∗∗∗p = 0.0001; determined by log rank test.
(E) Survival curves of 2 dpf zebrafish injected with 300 CFUs of S. pneumoniae D39V PLY+ or S. pneumoniae D39V PLY+ ΔcomCDE into the hindbrain ventricle and treatment with 100 μM GSK′872 (RIPK3 inhibitor) or vehicle (DMSO). The data represent the mean ± SEM of three biological replicates with 20 larvae per group (n = 60 in total/group); ∗p = 0.0177, ∗∗∗p = 0.0006, ∗∗∗∗p < 0.0001; determined by log rank test.