
|
FIGURE 8
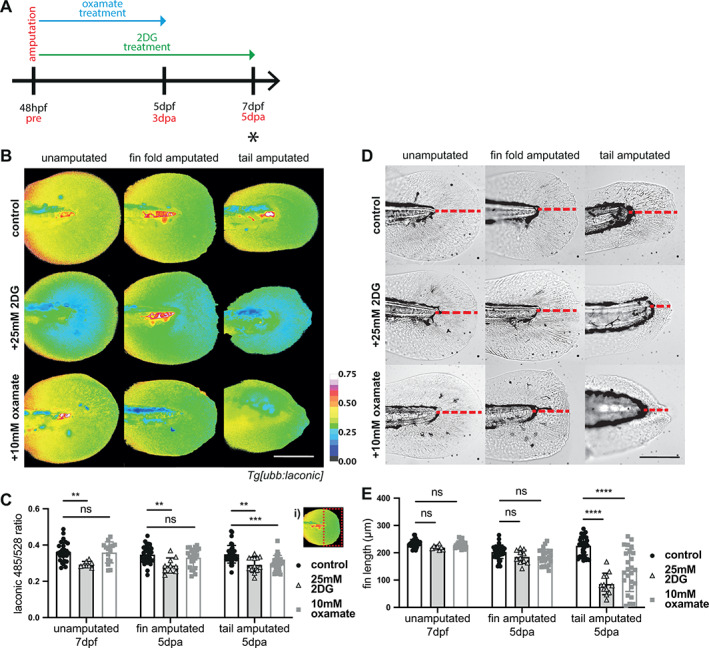
Glycolysis inhibition in regeneration. (A) Schematic of the experimental design. Embryos were amputated and incubated in treatment solution for 72 h or 120 h as indicated by the blue (oxamate) and green (2DG) arrows. Black asterisks indicates time point for imaging, at 5 dpa upon completion of regeneration. (B) Micrographs of representative