
|
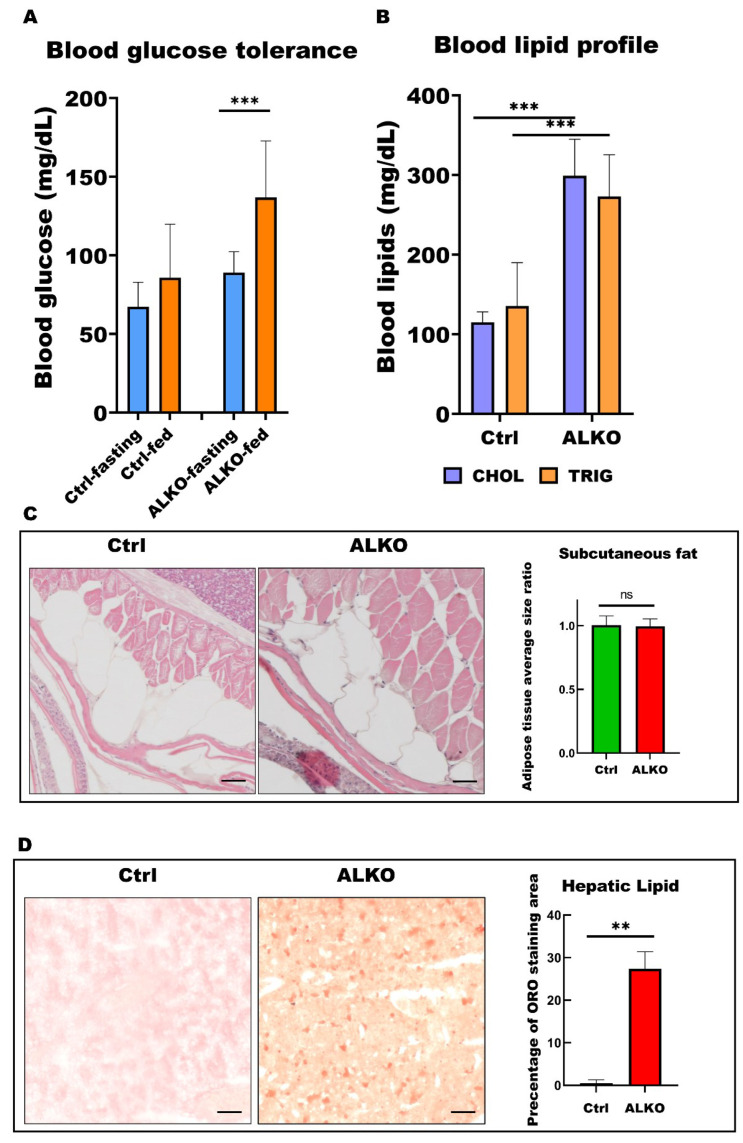
Figure 3 ALKO presented a typical metabolic syndrome outcome in adult. (A) Blood glucose contents of control and ALKO adults 5-month post-fertilization (mpf) at fasting and 90 mins after feeding. Values of Ctrl-fasting = 67.3636 ± 15.4872, Ctrl-fed = 85.75 ± 34.0619, ALKO-fasting = 89 ± 13.2581, and ALKO-fed = 136.833 ± 35.9415. (B) Blood lipid contents of control and ALKO adults at 5 mpf. CHOL: Total cholesterol content (mg/dL); TRIG: Total triglyceride content (mg/dL). Values of CHOL in Ctrl = 115 ± 13.2288, and ALKO = 299 ± 45.9239. Values of TRIG in Ctrl = 135.667 ± 54.3722, and AKOL = 273 ± 52.5071. (C) Characterization of subcutaneous fat in ALKO and control at 5 mpf. Scale bar: 50 μm. Values of adipose tissue average size ratio in Ctrl = 1.0041 ± 0.0738, and ALKO = 0.9946 ± 0.0595. (D) Histological images of hepatic ORO sections revealed a non-alcohol fatty liver phenotype in ALKO at 5 mpf. Scale bar: 50 μm. Percentage of ORO staining area in Ctrl = 0.481 ± 0.7925, and ALKO = 27.356 ± 4.0251. Statistically significant differences from the controls are indicated by ** p < 0.01, and *** p < 0.001.