
|
Fig. 4
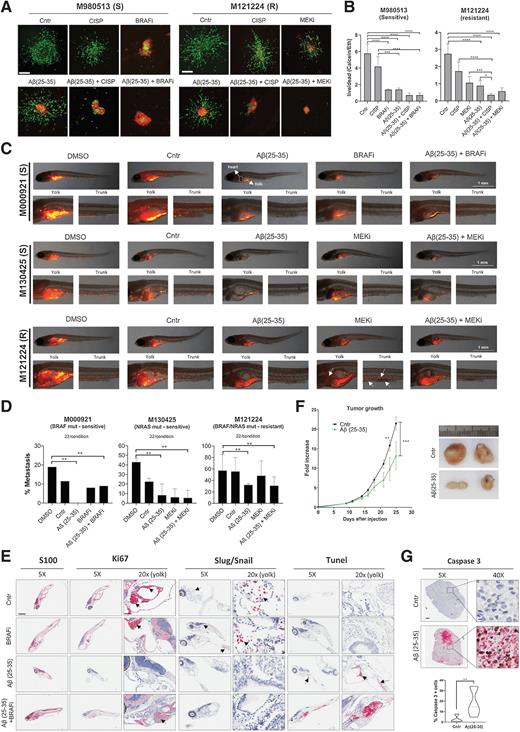
Aβ(25–35) prevents melanoma invasion and metastasis formation in vivo. A and B, M980513 (S, sensitive) and M121224 (R, resistant) spheres were implanted into a matrix of collagen I and treated with Aβ(25–35) 40 μmol/L ± cisplatin/BRAFi/MEKi. A total of 168 hours later, spheres were stained to evaluate the live (calcein; green)/dead (ethidium; red) cells. Scale bar, 30 μm. B, The live/dead ratio was analyzed in six spheres/condition by Photoshop. C, MAPKi-sensitive and resistant melanoma cells were stained with Vibrant Dye (red) and injected into the yolk of zebrafish larvae. Twenty-four hours later, zebrafish were treated with BRAFi/MEKi and Aβ(25–35) was injected into the yolk the day after. Pictures were taken 4 days later and the number of zebrafish with metastasis (D) was evaluated by two blind investigators. Data represent the mean ± SD of two independent experiments (tot = 660). One-way ANOVA was used for statistical analysis. **, P < 0.01; ***, P < 0.001. E, M000921-injected zebrafish were stained with S100, Ki67, Slug/Snail, and TUNEL. Scale bar, 500 μm (5×) and 100 μm (20×). F, A total of 500000 M121224 cells were subcutaneously injected in 9-weeks-old female nude mice. When tumor reached approximately 50 mm3, BSA or 15 μg Aβ(25–35) was intratumorally injected three times a week. Tumor growth was measured using an electronic caliper. Mice were sacrificed when control tumors reached 1,000 m3. Fold increase was calculated using each individual measure at day 7 to standardize. Representative images are shown (n = 5–8 tumors/group. G, Caspase-3 staining was performed on six tumors/group and quantified by QuPath. Scale bar, 4 mm (5×) and 200 μm (40×). Two-way Anova; **, P ≤ 0.01.