
Fig. 6
- ID
- ZDB-IMAGE-221226-46
- Publication
- Tanimoto et al., 2022 - Tiltable objective microscope visualizes selectivity for head motion direction and dynamics in zebrafish vestibular system
- All Figures
- Figures for Tanimoto et al., 2022
|
Fig. 6
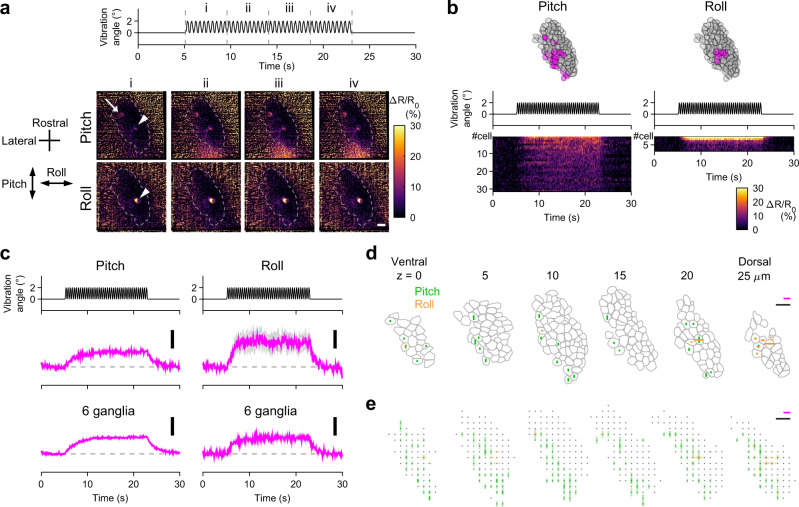
a Example of VGN responses to head vibration in pitch/roll axis (see Supplementary Movie 6). Vibration time course (top). Sequential images showing changes of mean ΔR/R0 during the time period “i” to “iv” from those during the pre-stimulus period (time 0 to 5 s) (bottom). Maximum intensity projection of VGNs in the rostral division of VG spanning a depth of 25 μm in a Tg(myo6b:jGCaMP7f; myo6b:tdTomato) larva imaged from ventral at 5 dpf. One neuron responds to both stimuli (arrowheads) whereas another responds to only pitch vibration (arrow). Dashed lines: VG contours. Scale bar: 10 μm. b Example of vibration responses per VGN. The same ganglion shown in (a). Responses to pitch (left) and roll (right) vibration. Location of activated (magenta) and not-activated (gray) VGNs (top, 6 optical slices overlaid). Vibration time course (middle). Responses (ΔR/R0) per activated VGNs (bottom). c Mean responses in activated VGNs. Vibration time course (top). Mean ΔR/R0 (middle). Pitch: 31 cells. Roll: 8 cells. Mean ΔR/R0 in 6 ganglia (bottom). Deviation (SEM) is shown in gray. Scale bar: 10% ΔR/R0. Example (d) and summary (e) of VGN response vectors. Magenta scale bar: 20% ΔR/R0. Black scale bar: 10 μm. d The same VG shown in (a). Bars indicate ΔR/R0 amplitude in activated VGNs. Gray: VGN contours. e Responses from 6 VG shown in translucent, overlaid bars (see “Methods”). Gray dots: not-activated VGNs. Source data are provided as a Source Data file.