
Fig. 4
- ID
- ZDB-IMAGE-221226-44
- Publication
- Tanimoto et al., 2022 - Tiltable objective microscope visualizes selectivity for head motion direction and dynamics in zebrafish vestibular system
- All Figures
- Figures for Tanimoto et al., 2022
|
Fig. 4
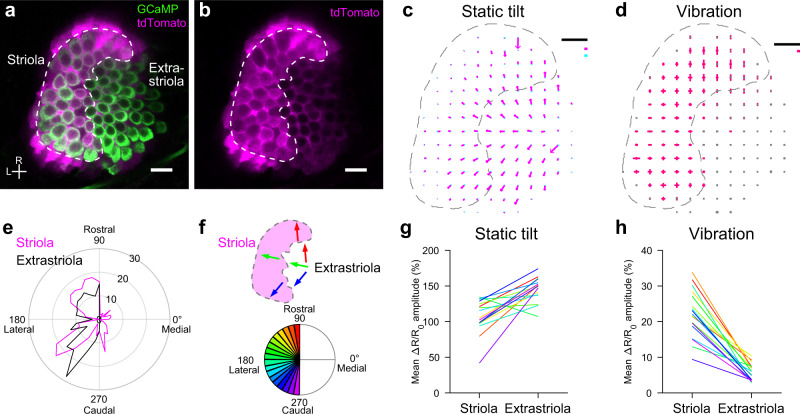
a, b A horizontal optical slice of utricle in a 5 dpf transgenic fish, Tg(myo6b:jGCaMP7f; s100s-hs:tdTomato). Striola is enclosed by a dashed line. Scale bar: 10 μm. R: rostral. L: lateral. Similar results were obtained in 6 experiments. c, d Summary of HC response vectors from 6 utricles. Mean ΔR/R0 vectors per grid. Striola is enclosed by a dashed line. Black scale bar: 10 μm. c Orientation and length of arrows indicate preferred (magenta)/anti-preferred (cyan) direction and ΔR/R0 amplitude, respectively. Magenta and cyan scale bars: 100% ΔR/R0 (d) orientation and length of bars indicate stimulus direction and ΔR/R0 amplitude, respectively. Magenta scale bar: 20% ΔR/R0. e Polar histogram showing number of HCs (radial axis) against HC polarity (angular axis) determined by orientation of tilt response vectors. Bin size: 10°. f Example of HC groups, each of which has a similar polarity (top). Color code for HC polarity groups with bin size 10° (bottom). g, h Pairwise comparison of mean ΔR/R0 response vector length between striolar and extrastriolar HCs in 6 utricles (18 HC polarity groups). Color code shown in (f). Two-sided Wilcoxon signed-rank test (g, p = 1.1 × e−4; h, p = 7.6 × e−6). Source data are provided as a Source Data file.