
Figure 3
- ID
- ZDB-IMAGE-221226-320
- Genes
- Publication
- Bandla et al., 2022 - A New Transgenic Tool to Study the Ret Signaling Pathway in the Enteric Nervous System
- All Figures
- Figures for Bandla et al., 2022
|
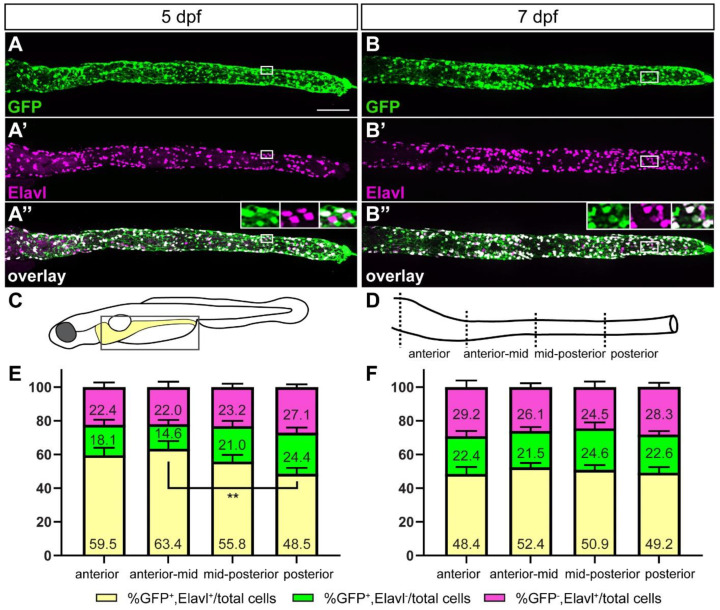
Figure 3 The majority of GFP+ cells are ENS neurons at later stages of ENS development. At 5 (A–A”) and 7 (B–B”) days post fertilization (dpf) GFP+ ENS neurons (white) are found along the whole length of the gut. A smaller fraction are GFP+ non-neuronal cells (green) or GFP− ENS neurons (magenta). Insets in (A”,B”) show the close-up of the boxed area, GFP, Elavl, and overlay from left to right. Schematic of boxed area of larval schematic (C) indicates the four gut sub-regions analyzed (D). Quantification of GFP and Elavl colocalization at 5 dpf (E) and 7 dpf (F) in four gut regions shown in (D). Bar graph shows % GFP+/Elavl+ out of total number of cells quantified [GFP+/Elavl+, GFP+/Elavl−, and GFP−/Elavl+], (yellow), % GFP+/Elavl− out of total cells (green), and % GFP−/Elavl+ out of total cells (magenta). Using 2-way ANOVA, we did not find significant differences between the cell populations of the different gut regions except where indicated (** p ≤ 0.01). Error bars show ±standard error of the mean (5 dpf: 2 experiments, 19 larvae; 7 dpf: 2 experiments, 15 larvae). (A–A”,B–B”): maximum projections of dissected guts at stage indicated. Scale bar = 100 µm.