
Image
|
Figure Caption
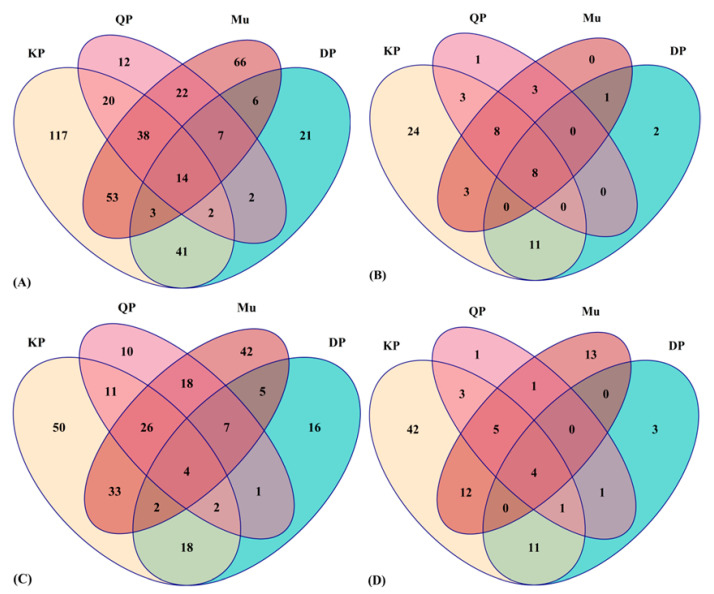
Figure 3 Venn diagram distribution of the total number of phytochemicals (A), the total number of phenolic acids (B), the total number of flavonoids (C), and the total number of other polyphenols (D) in Muntries (Mu), Kakadu plum (KP), Davidson plum (DP) and Quandong peach (QP).
Acknowledgments
This image is the copyrighted work of the attributed author or publisher, and
ZFIN has permission only to display this image to its users.
Additional permissions should be obtained from the applicable author or publisher of the image.
Full text @ Foods