
|
Figure 8
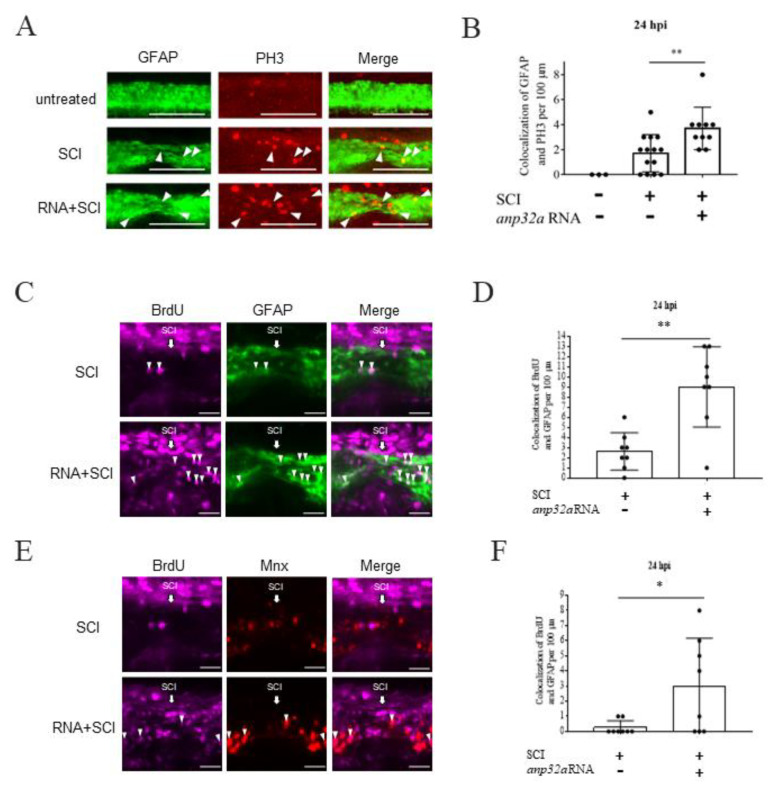
Proliferation and cell number of radial glial cells and motor neurons were increased in the Anp32a-overexpression SCI embryos. The Anp32a mRNA was microinjected into the one-cell stage of embryos from zebrafish transgenic lines (A,B) Tg(gfap:GFP) and (C–F) the crossed strain of Tg(gfap:GFP) and Tg(mnx1:TagRFP), followed by BrdU injection, SCI at 48 hpf, and finally, staining with PH3 at 24 hpi. (A) Proliferation patterns at the lesion site of Tg(gfap:GFP) embryos treated as indicated at 24 hpi were displayed by immunofluorescence through reaction with antibodies against phosphorylated histone H3 (PH3; Red) and observation under laser confocal microscopy. (B) Statistical analysis showed a significantly increased number of PH3-positive cells in Anp32a-overexpressed SCI embryos (n = 10) compared to untreated embryos (n = 3) and SCI-control embryos (n = 14) at 24 hpi. One-way ANOVA followed by Tukey’s multiple comparison test was used to perform statistical analysis (*, p < 0.05; ** p < 0.01; error bars indicate mean ± SD). (C) Proliferation patterns at the lesion site of transgenic cross strain Tg(gfap:GFP) X Tg(mnx1:TagRFP) embryos treated as indicated at 24 hpi showing GFAP-positive cells (green) colocalized with BrdU-positive cells (purple) around the lesion area. (D) Statistical analysis of GFAP +/BrdU+ colocalized cells in SCI-control and Anp32a-overexpressing SCI embryos. (E) Proliferation patterns at the lesion site of Tg(gfap:GFP) X Tg(mnx1:TagRFP) embryos treated as indicated at 24 hpi showing red-labelled motor neurons colocalized with BrdU-positive cells (purple) around the lesion area. The specimens in Figure 8C, F originated from the same embryos. (F) Statistical analysis of motor neuron +/BrdU + colocalized cells in SCI-control and Anp32a-overexpression SCI embryos. Scale bar: 100 μm; (D,F) Student’s t-test was used to perform statistical analysis (* p < 0.05; ** p < 0.01; error bars indicate mean ± SD).